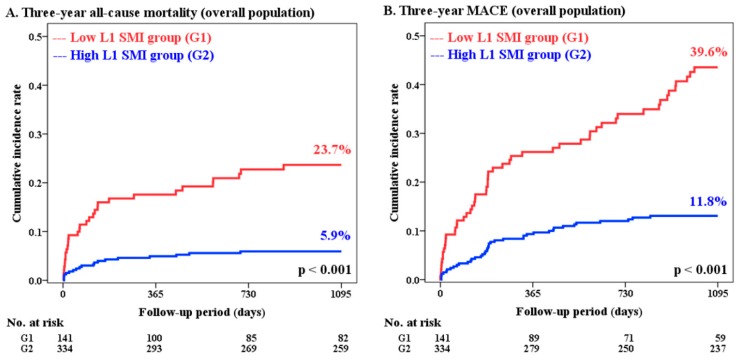
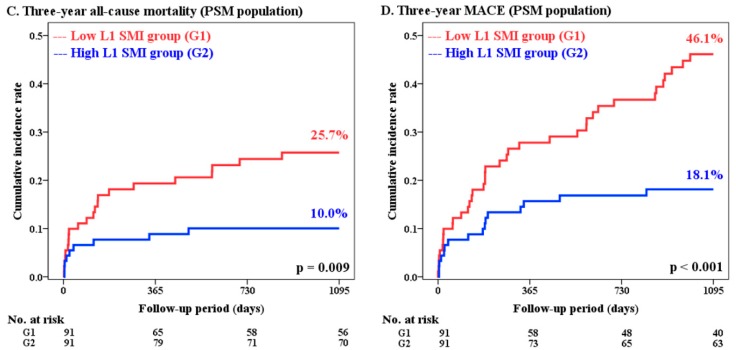
Figure 2.
Cumulative incidence rates of 3-year clinical outcomes according to the groups divided by L1 SMI. Results for the overall population (A,B) and PSM population (C,D) are displayed: 3-year all-cause mortality (A,C) and 3-year MACEs (B,D). L1 = first lumbar vertebra; MACE = major adverse cardiovascular event; PSM = propensity score-matched; SMI = skeletal muscle index.


