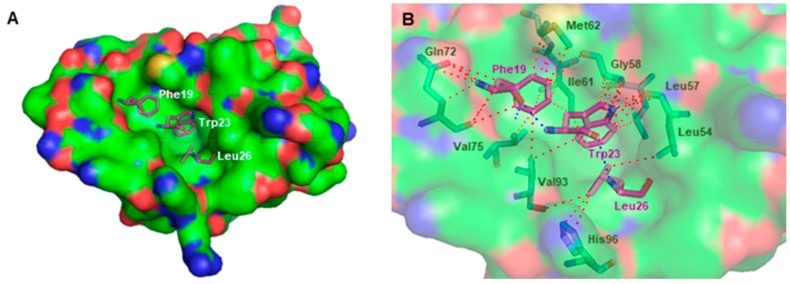
Figure 5.
(A) Crystallographic p53 (for simplification, only Phe19, Trp23, and Leu26 residues are represented as purple sticks) bound to the three pockets of MDM2 (solid surface). (B) Binding mode of crystallographic p53 (for simplification, only residues Phe19, Trp23, and Leu26, are represented as purple sticks) in the hydrophobic cleft of MDM2 (transparent surface); MDM2 amino acid residues involved in interactions with p53 are represented as green sticks. Structural data were obtained from the X-ray crystal structure of MDM2-p53 complex (Protein Data Bank (PDB) id 1YCR). MDM2 is represented as surface, where carbon, oxygen, nitrogen, and sulfur are represented in green, red, blue, and yellow, respectively. Hydrogen-bonding interactions are depicted with a dashed blue line. Other types of interactions are represented as a dashed red line.

