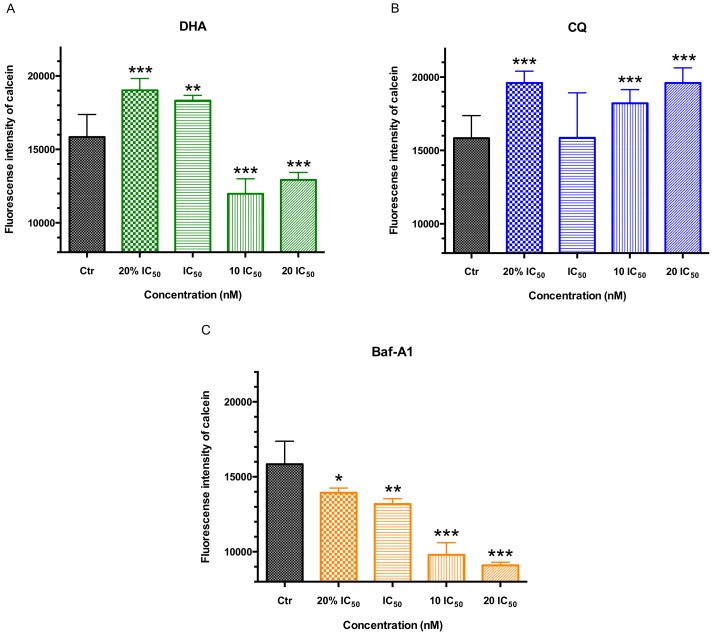
Figure 6.
The fluorescence intensity of intracellular irons at trophozoite stage P. f 3D7 staining with calcein, AM after 2 h of single drug treatment with a series dose of antimalarial drugs DHA/CQ or V-ATPase inhibitor Baf-A1 by flow cytometry. (A) Fluorescence intensity of BCECF in trophozoite stage P. f 3D7 treated by DHA; (B) Fluorescence intensity of BCECF in trophozoite stage P. f 3D7 treated by CQ; (C) Fluorescence intensity of BCECF in trophozoite stage P. f 3D7 treated by Baf-A1. Ctr means control. Data shown are mean ± SEM (n ≥ 3). * p < 0.05, ** p < 0.01 or *** p < 0.001 vs. control.

