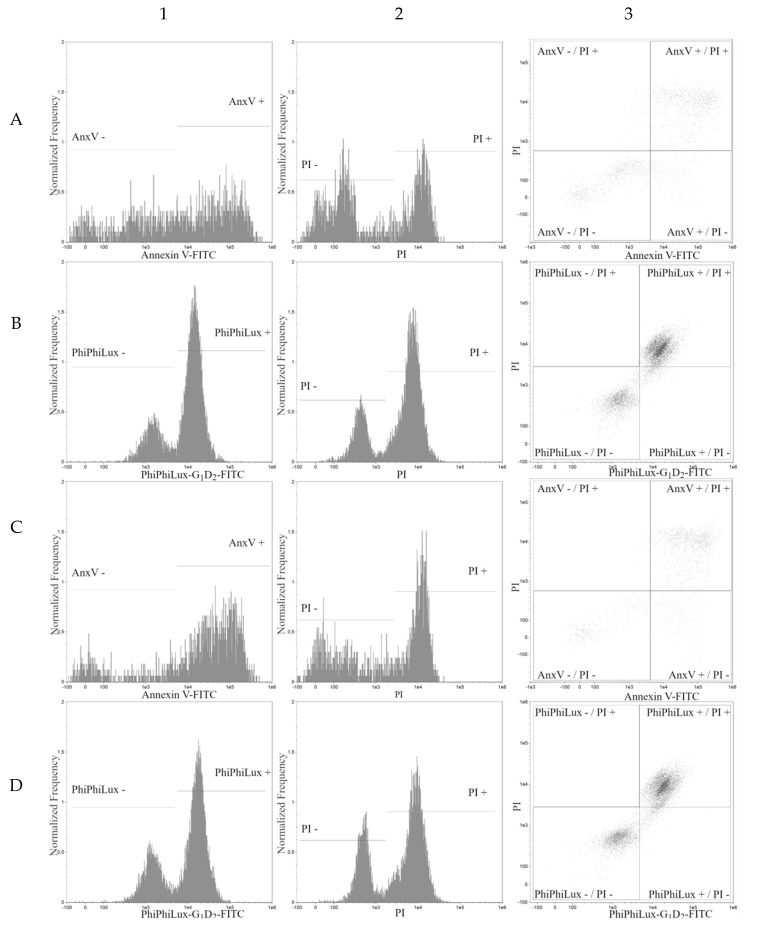
Figure 4.
Apoptosis analysis of HL60 cell line. Graphs taken from FlowSight cytometer. All axes are shown in a logarithmic scale. (Columns: 1—Annexin V-FITC and PhiPhiLux-G1D2-FITC histogram; 2—propidium iodide histogram; 3—Annexin V-FITC/propidium iodide dot plot and PhiPhiLux-G1D2-FITC/propidium iodide dot plot; Rows: A, B—IC50 of pterostilbene; C, D—IC50 of pterostilbene with mitoxantrone. Rows A, C—Annexin V-FITC/propidium iodide assay; B, D—PhiPhiLux-G1D2-FITC/propidium iodide assay).

