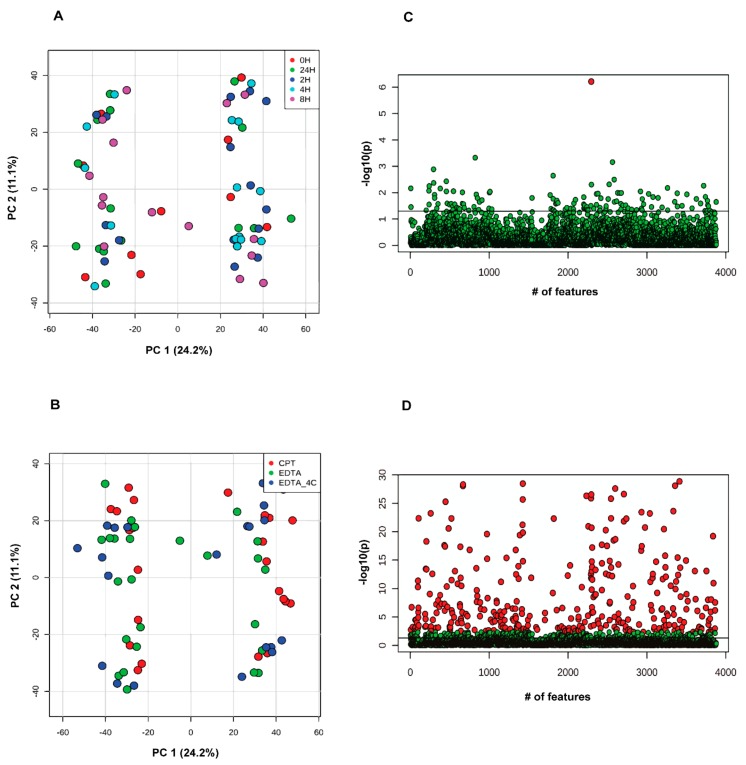
Figure 2.
Principal component analysis in donor-unmatched samples from lipidomics data acquired in positive ionization mode. Samples are grouped by (A) storage time and (B) anticoagulants used. Analysis of variance with Fisher’s Least Significant Difference (LSD) test at adjusted p-value at 0.05 grouped by (C) storage time (red dot show p-value < 0.05) and (D) anticoagulants (red dots show p-value <0.05). Note: The Y-axis scale of scatter plot is automatically adjusted by Metaboanalyst based on the range of −log10(p). The line on the scatter plot demarcates the −log10(0.05) value on Y-axis.

