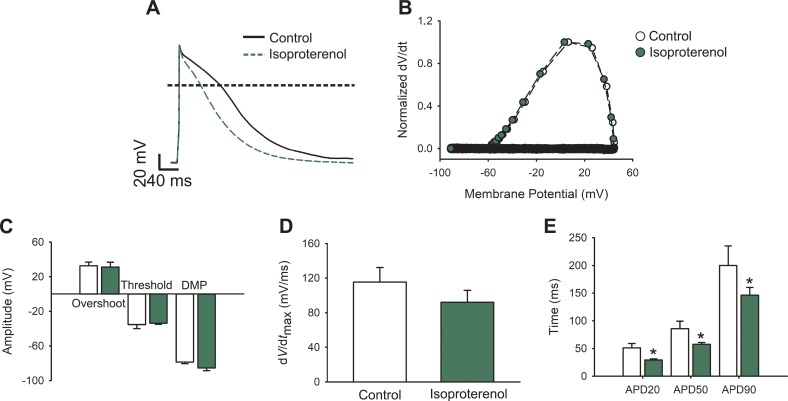
Figure 1.
APs from isoproterenol-treated cardiomyocytes. (A) Representative AP waveforms from a cardiomyocyte before (black solid line) and after (green dashed line) 100 nM isoproterenol application. APs were elicited by 2–5 ms depolarizing current injections (100–200 pA) at 1 Hz. The horizontal line indicates zero level. (B) Phase plot of the normalized first derivative of membrane potential (dV/dt) against membrane potential (Vm) for the APs shown in A. (C) Bar graph of overshoot, threshold potentials, and mean DMPs. (D) Bar graph of maximum rate of potential change (dV/dtmax). (E) Bar graphs of APD estimated at 20%, 50%, and 90% of the repolarization phase (APD20, APD50, and APD90, respectively). Bar graphs are mean ± SEM; empty bars are control cardiomyocytes, and green bars correspond to isoproterenol-treated cardiomyocytes (n = 10; *P < 0.01, with respect to control).

