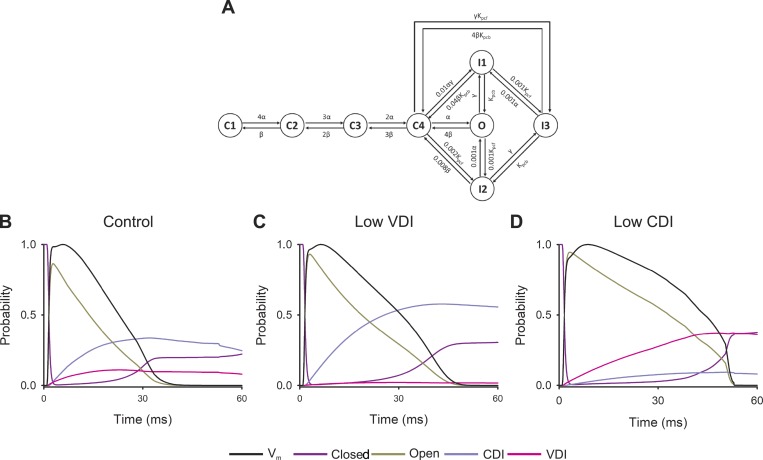
Figure 3.
L-type channel inactivation processes during the AP. (A) State diagram of the model for L-type Ca2+ channel, the model assumes four closed states (C1, C2, C3, C4), three inactivation states (I1, I2, I3), and one open state (O). Voltage-dependent constants are α and β while γγ is calcium dependent. Kpcf and Kpcb are voltage-insensitive rate constants. (B–D) Probability of open (dark yellow line), closed (violet line), CDI (light purple line), or VDI (pink line) states of LTCCs during a simulated AP simulated in control cardiomyocytes (A) or with reduced VDI (B) or CDI (C). Normalized membrane potential (Vm, black line) for each scenario is shown for comparison.

