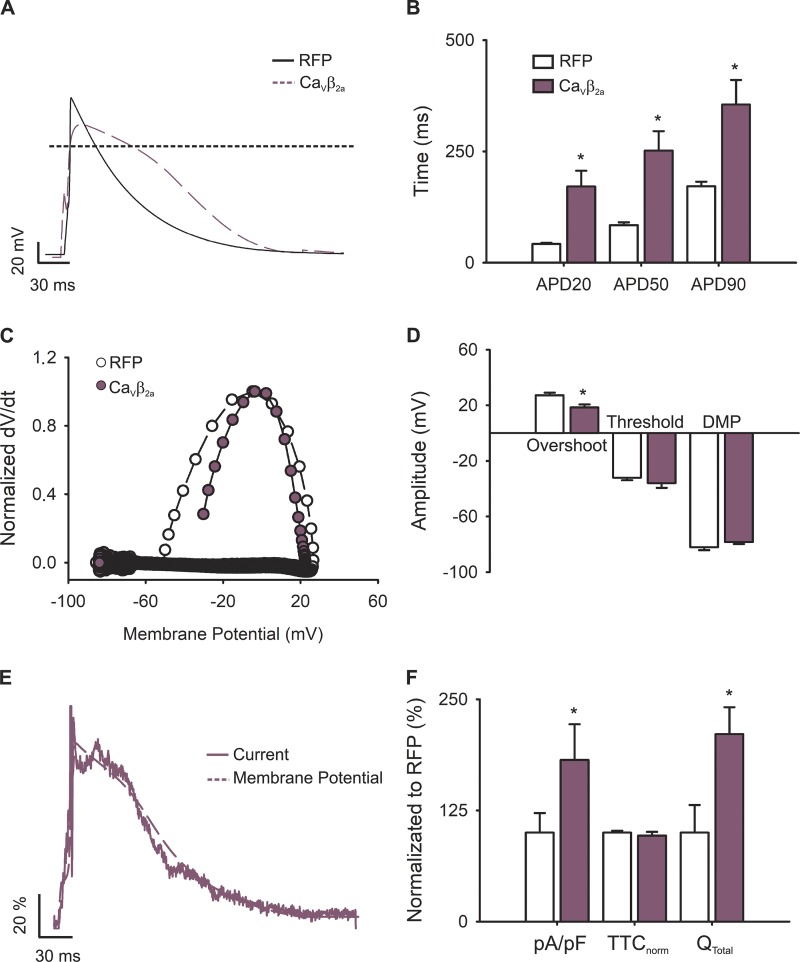
Figure 6.
APs and L-type calcium currents in VDI-impaired newborn rat cardiomyocytes. (A) Representative AP waveforms from a newborn rat cardiomyocyte overexpressing RFP (solid black line) or CaVβ2a (dashed plum line). APs were elicited by 2–5 ms depolarizing current injections (100–200 pA) at 1 Hz. (B) Bar graph of APD estimated at 20% (APD20), 50% (APD50), and 90% (APD90) of the repolarization phase. (C) Phase plot of the normalized first derivative of membrane potential (dV/dt) against membrane potential (Vm) for the APs shown in A. Cardiomyocytes overexpressing RFP are shown with empty symbols and cardiomyocytes overexpressing CaVβ2a with plum symbols. (D) Bar graph of overshoot, threshold potentials, and mean DMPs. (E) Representative nifedipine-sensitive current (solid line) elicited by the AP (dashed line) prerecorded from the same cardiomyocyte overexpressing CaVβ2a. (F) Bar graph of maximal current normalized by cell capacitance (pA/pF), total time of nifedipine-sensitive current normalized by its APD (TTCnorm), and the total current integral normalized by cell capacitance (Qtotal). Data are presented as percentages with respect to RFP-transduced cardiomyocytes. Bar graphs are mean ± SEM; empty bars represent cardiomyocytes overexpressing RFP, and plum bars correspond to those overexpressing CaVβ2a (n = 6; *, P < 0.01 with respect to RFP).

