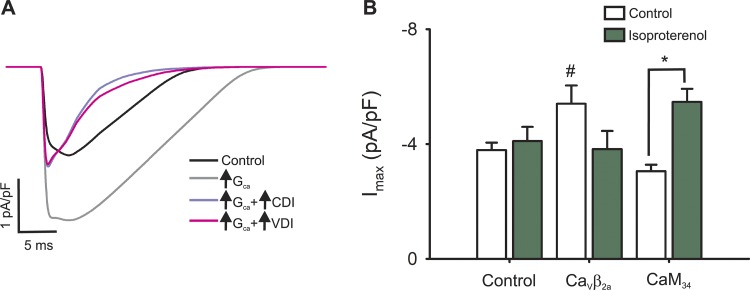
Figure 7.
Role of L-type channel inactivation processes during a simulated AP. (A) Simulated L-type calcium current for the control condition (black line) or for cardiomyocytes with increased L-type channel conductance alone (light gray line) or simultaneously with an increased CDI (violet line) or VDI (pink line). (B) Experimental data showing the maximal nifedipine-sensitive current from control, CaVβ2a, and CaM34 before (empty bars) or after (green bars) isoproterenol stimulation. #, P < 0.01 with respect to control; *, P < 0.01 between values before and after isoproterenol stimulation.

