Figure 3.
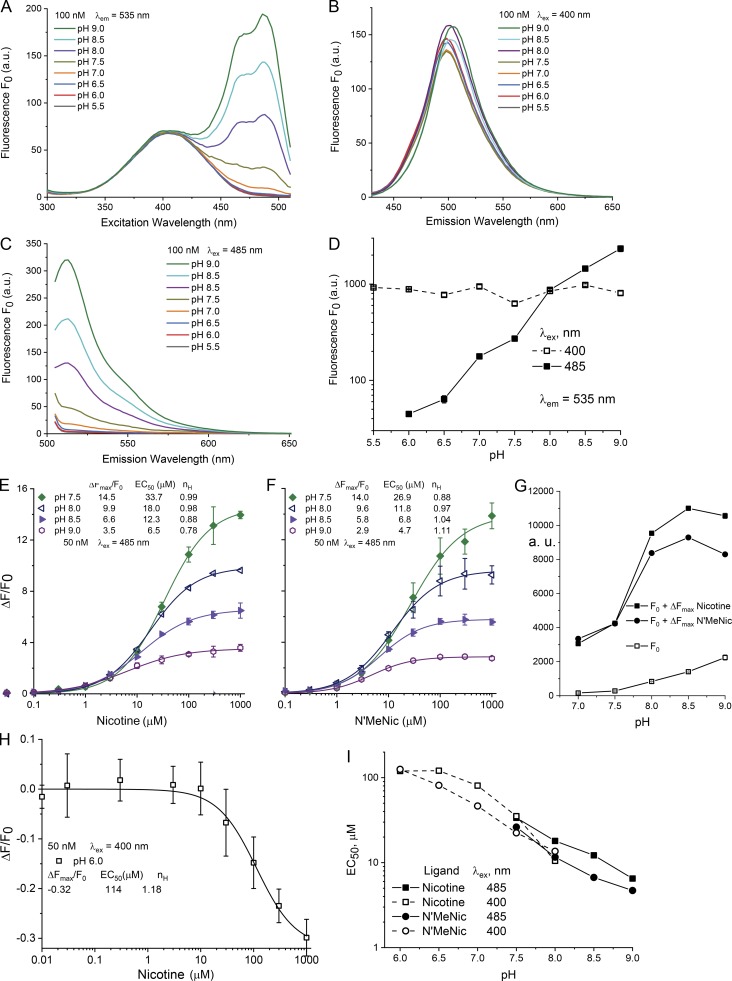
The pH dependence of purified iNicSnFR3a in solution, over the range pH 5.5–9.0, at 25°C. Measurements were performed in 3× PBS, adjusted to nominal pH within 0.1 pH unit. (A–C) Measurements in a spectrofluorometer (see Materials and methods). 100 nM protein. Fluorescence is measured in the absence of ligand and termed F0. (A) Excitation spectra at various pH values, measured at a λem of 535 nm. (B) Emission spectrum at a λex of 400 nm. Note that F0 depends to only a limited extent on the pH. (C) Emission spectrum at λex = 485 nm. Note the strong dependence on pH. (D–H) Measurements in a 96-well plate reader, bandwidth 20 nm for excitation and 25 nm for emission; 50 nM protein, 25°C. (D) Data analogous to those of B and C. pH dependence of F0, with λex = 400 nm (open symbols) or 485 nm (closed symbols). Arbitrary units on the y axis (log scale; 30–3,000 arbitrary units; a.u.) differ from those taken with the instrument of A–C. Values for SEM are smaller than the size of the symbols. (E and F) Fluorescence dose–response relations for nicotine (E) and for N’MeNic (F). Excitation at 485 nm, at varying pH between 7.5 and 9.0. The data have been fitted to a single Hill equation, with parameters given in the legend. Error bars give SEM. Uncertainties for the ΔFmax/F0 and EC50 values are <10%, and for the Hill coefficient (nH) value are <0.2. (G) Summary of E and F to show both the unliganded fluoresce (F0) and maximal fluorescence (F0 + ΔFmax) in the pH range measured. (H) Exemplar dose–response relations from excitation at 400 nm, at pH 6.0. As expected (Barnett et al., 2017), nicotine produces a decrease in fluorescence intensity at 535 nm. The data have been fitted to a single Hill equation, with parameters given in the legend. Error bars give SEM. (I) Comparison of EC50 values for nicotine (squares) versus N’MeNic (circles). Data from experiments like those in B and C. Excitation at 400 and 485 nm are given by the open and closed symbols, respectively. Data were included if they were well fitted by a Hill coefficient between 0.75 and 1.2, if the observed ΔF at 1,000 µM ligand reached >85% of the fitted ΔFmax, and if the curve-fitting algorithm provided error bounds of EC50 < 10%.

