Figure 4.
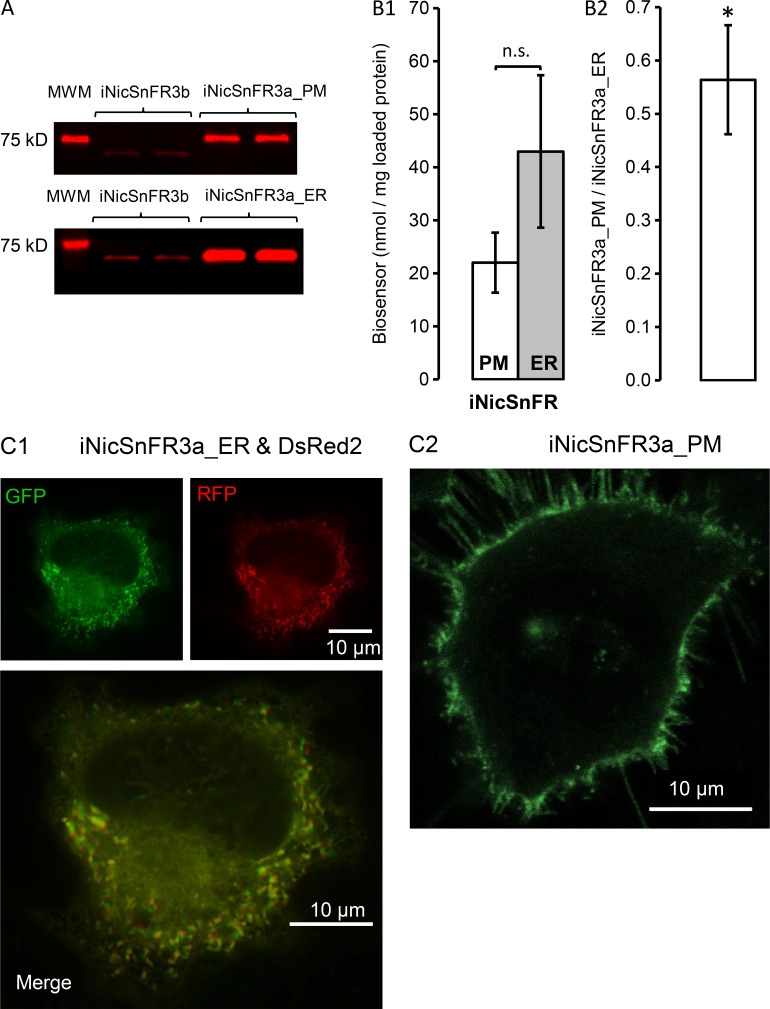
Protein levels and subcellular imaging of iNicSnFR3a_PM and iNicSnFR3a_ER in HeLa cells. (A) Typical immunoblots with anti-GFP immunoreactivity to lysates (1 µg protein) from HeLa cells transfected with either iNicSnFR3a_PM (top) or iNicSnFR3a_ER (bottom). In each panel, the leftmost lane is the 75-kD molecular weight marker (MWM). The two middle lanes are duplicate samples of purified, diluted iNicSnFR3b (∼61 kD). The two rightmost lands are duplicate samples from the transfected cells. Bands for iNicSnFR3a_PM appear at ∼68 kD (slightly below the MWM), and bands for iNicSnFR3a_ER appear at ∼61 kD (markedly below the MWM and comparable with purified biosensor), confirming the predicted size difference of 7 kD between the two constructs. (B1) Absolute quantitation of iNicSnFR3a expression, based on GFP immunoblots, from five paired transfections, analyzed 7–23 h after transfection. Data are mean ± SEM (two duplicate lanes loaded with 1 µg protein per blot; one blot per transfection). Significance was determined using an unpaired Student’s t test. *, P ≤ 0.05; n.s., not significant. (B2) Ratio of iNicSnFR3a_PM to iNicSnFR3a_ER levels, within each set of transfections. The ratio varied from 0.40 to 0.95 with an average of 0.56 ± 0.10. The bar gives SEM. (C) Typical fluorescence microscopy images from cells cotransfected with iNicSnFR3a and with DsRed2-ER (red channel) and exposed to nicotine (15 µM). (C1) iNicSnFR3a_ER (green channel) and DsRed2-ER (red channel) and merged image. Structured illumination microscopy. (C2) iNicSnFR3a_PM (only the green channel is shown). Confocal microscopy.

