Figure 9.
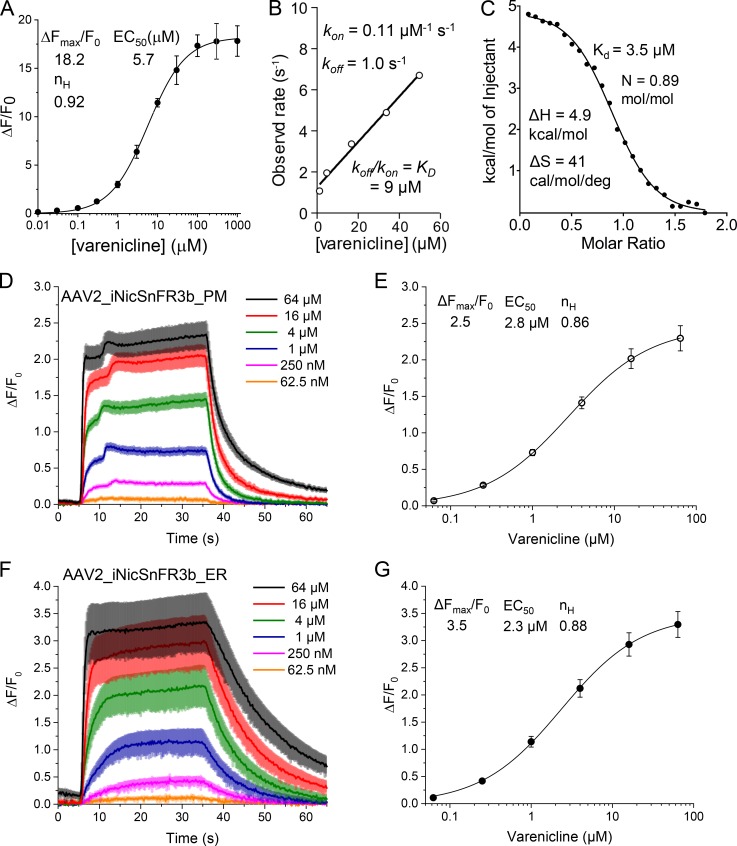
Varenicline activity against purified iNicSnFR3a (A–C) and iNicSnFR3b expressed in hippocampal neurons (D–G). (A) Dose–response relations for varenicline-induced ΔF/F0, measured in 3× PBS, pH 7.4. Mean ± SEM; three measurements. (B) Stopped-flow measurements at various [varenicline]. (C) Isothermal titration calorimetry. (D–G) Exemplar varenicline-induced fluorescence increases for cultured hippocampal neurons transduced with AAV2/1.syn1.iNicSnFR3b_PM (D and E) or with AAV2/1.syn1.iNicSnFR3b_ER (F and G). (D and F) 30-s varenicline pulses, followed by 40-s wash in HBSS. The average waveform for five cells at each [varenicline] is overlaid for the PM and ER traces in A and C, respectively. The SEM is shown as colored bands around each line. (E and G) Dose–response relations, fitted to a single-component Hill equation, including zero response at zero [varenicline]. Parameters are shown.

