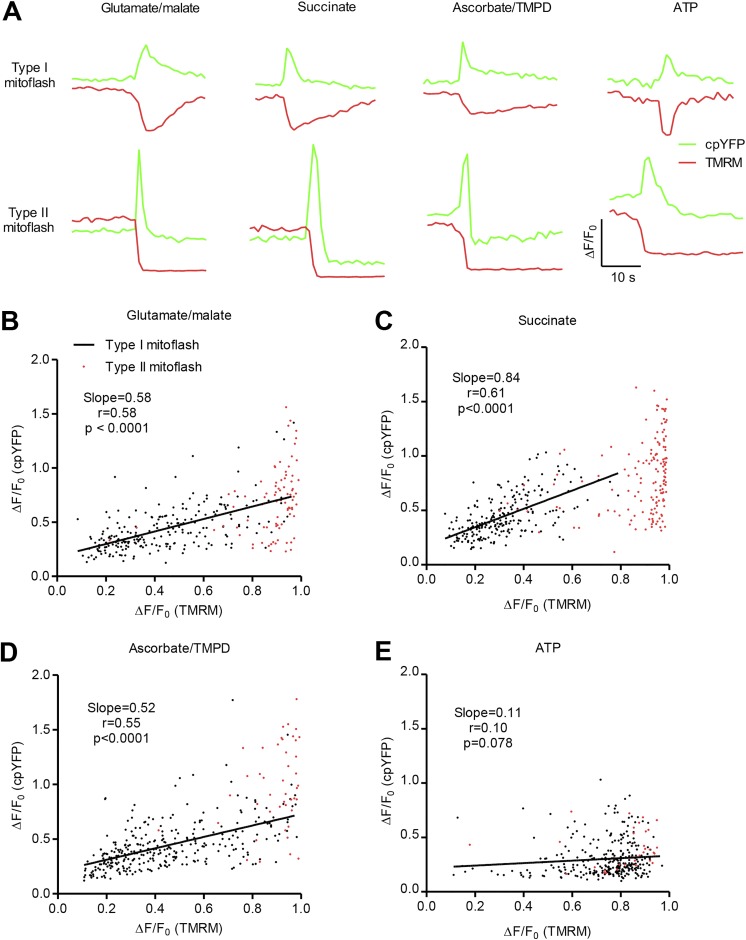
Figure 5.
Correlation between mitoflash amplitude and ΔΨm depolarization. (A) Representative traces of mitoflashes with transient or sustained ΔΨm depolarization. Data were obtained in the presence of 5 mM glutamate/5 mM malate, 2.5 mM succinate, 2.5 mM ascorbate/0.5 mM TMPD, or 3 mM ATP. (B–E) Scatter plots for amplitude of cpYFP-reported mitoflashes and companion TMRM-reported ΔΨm depolarization. Black or red dots represent events with transient or sustained ΔΨm depolarization, respectively. For mitoflashes with transient ΔΨm depolarization under different conditions, linear regression yielded a positive correlation between the amplitude of cpYFP-reported mitoflashes and TMRM-reported ΔΨm depolarization supported by Complex I substrates (n = 224 events; B), Complex II substrate (n = 222 events; C), and Complex IV substrates (n = 303 events; D). Note the weak correlation between the amplitude of mitoflashes and ΔΨm depolarization in ATP-supported events (r = 0.10, P = 0.078, n = 292 events; E). Note that sustained ΔΨm depolarization was often associated with large, near-complete loss of membrane potential (red dots, n = 83, 149, 45, and 35 events for data in B, C, D, and E, respectively).

