Figure 2.
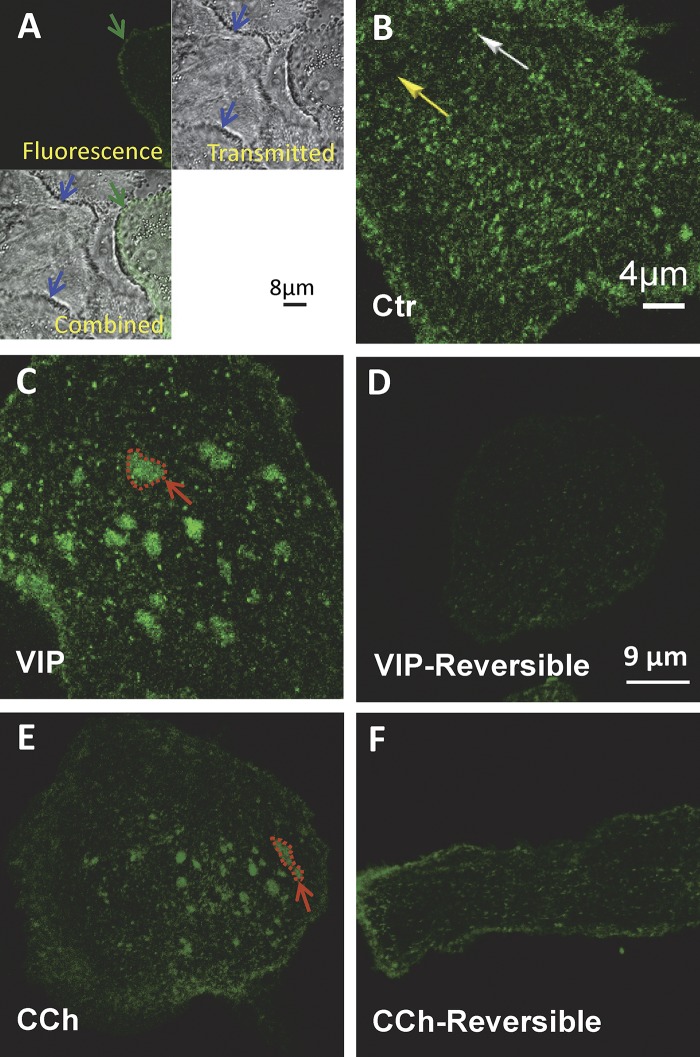
Reversible aggregation of EGFP-CFTR induced by VIP and CCh in pHBE cells. pHBE cells were transduced with EGFP-CFTR adenovirus and cultured on collagen-coated glass for 4 d. (A) Autofluorescence is negligible compared with EGFP-CFTR fluorescence. Upper left: Confocal image of pHBE cell transiently expressing EGFP-CFTR (green arrow). Upper right: Transmitted light image of the same field reveals the presence of nonfluorescent cells (blue arrows). Lower left: Combined image showing that autofluorescence of untransduced cells (blue arrow) is negligible compared with the EGFP-CFTR expressing cell (green arrow). (B) Distribution of EGFP-CFTR under Ctr conditions showing diffuse background staining (yellow arrow) and bright puncta (white arrow). (C) Aggregation of EGFP-CFTR into large (2–4 µm dia.) platforms after 20–30 min exposure to 200 nM VIP at 37°C (red arrow shows one example). The scale bar in B also applies to C. (D) Platforms have dispersed 24 h after VIP washout. (E) Aggregation of EGFP-CFTR into large platforms induced by 20–30 min exposure to 2 µM CCh at 37°C. (F) No platforms remain 24 h after CCh washout. The scale bar in D also applies to E and F.

