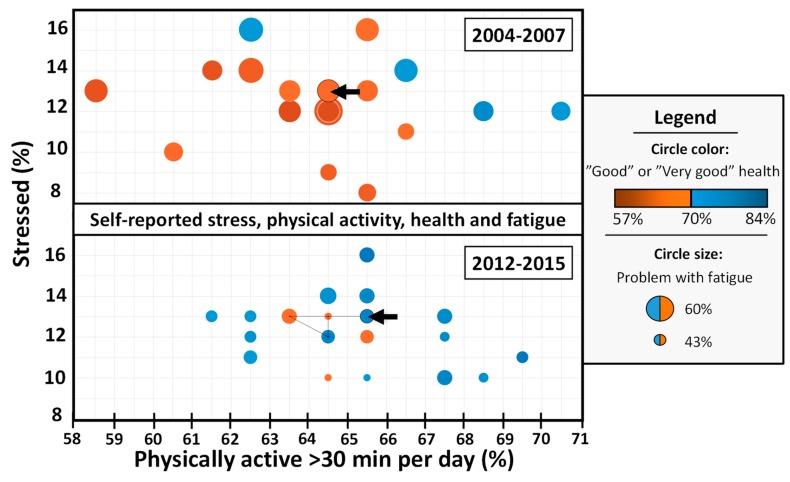
Figure 1.
Selected physical and mental health indicators of a Sweden cohort, in relation to the degree of physical activity for the period of years 2004–2007 (N = 29,254) and years 2012–2015 (N = 38,553). Surveyed subjects are age 16 to 84 years old, with data representing median scores of four years, not normalized for age. Y-axis: Percentage of subjects reporting “stressed”; X-axis: Percentage of subjects indicating physical active at least 30 minutes each day. Each dot represents one County (Län), dot-size indicates self-reported fatigue, and color self-reported healthiness of the County. If 70% of the population states they are having “Good/Very good” health, the dot is blue. If less than 70% states they are having good/very good health, the dot is red. The circle indicated with a black arrow corresponds to nation median. The black line connected to the nation circle represents the movement in the X–Y plane from the year 2004 to 2007, and from 2012 to 2015, respectively. Data retrieved from the Public Health Agency of Sweden 2019-04-22 (www.folkhalsomyndigheten.se).

