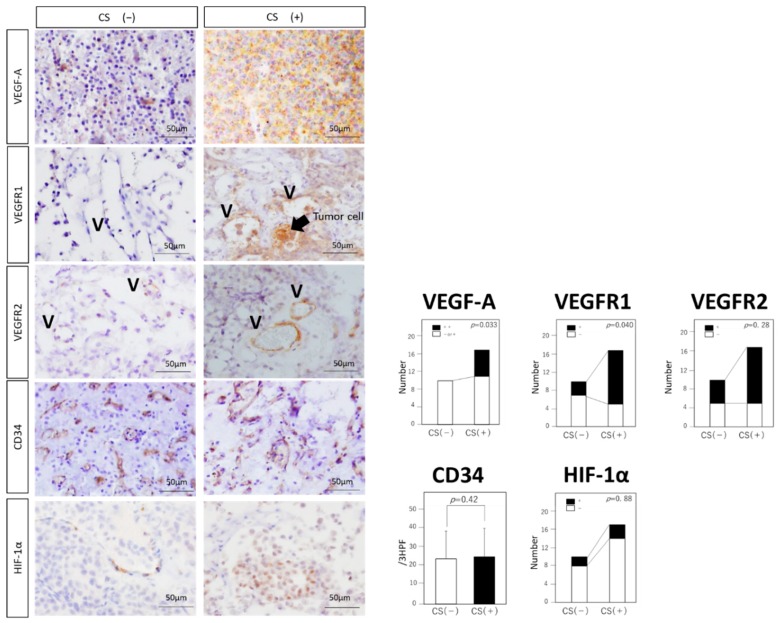
Figure 2.
Expressions of VEGF-A related molecules in NF-PitNETs. Immunohistochemical analysis of VEGF-A, VEGFR1, VEGFR2, CD34, and HIF-1. Typical examples of each staining are shown in both groups. Black arrow: tumor cells showing positive VEGFR1 expression. V: vascular structure (original magnification, ×20). Statistical analysis of each staining is shown. Expressions of VEGF-A and VEGFR1 are significantly higher in the CS (+) group than in the CS (−) group (VEGF-A: p = 0.033, VEGFR1: p = 0.040). Expressions of VEGFR2 and HIF-1α do not reach statistical significance (VEGFR2: p = 0.28, HIF1-α: p = 0.88). MVD shows no significant difference between the two groups (p = 0.42). Data represent the mean ± standard error of mean (VEGF-A, VEGFR1, VEGFR2 and HIF-1α, chi-squared test; MVD, student’s t-test).

