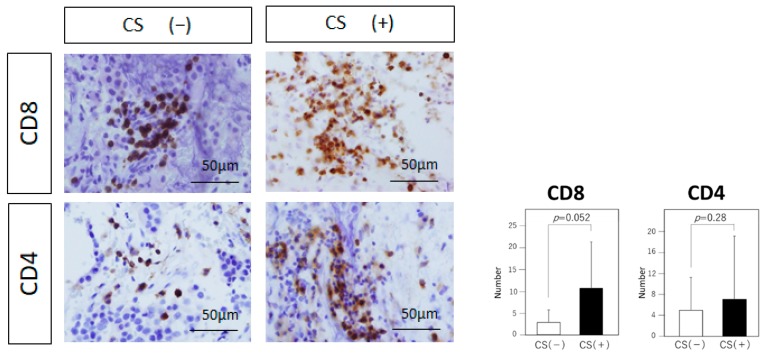
Figure 3.
Analysis of tumor-infiltrating lymphocytes. Immunohistochemical analysis of CD8 and CD4 (Original magnification, ×20). Typical examples of each staining are shown in both groups. Statistical analysis of each staining is shown. The number of CD8 (+) lymphocytes tends to be higher in the CS (+) group than in the CS (−) group, but the difference is not statistically significant (p = 0.052). The number of CD4 (+) lymphocytes shows no significant difference between the two groups (p = 0.28). Data represent the mean ± standard error of mean (CD4 and CD8, student’s t-test).

