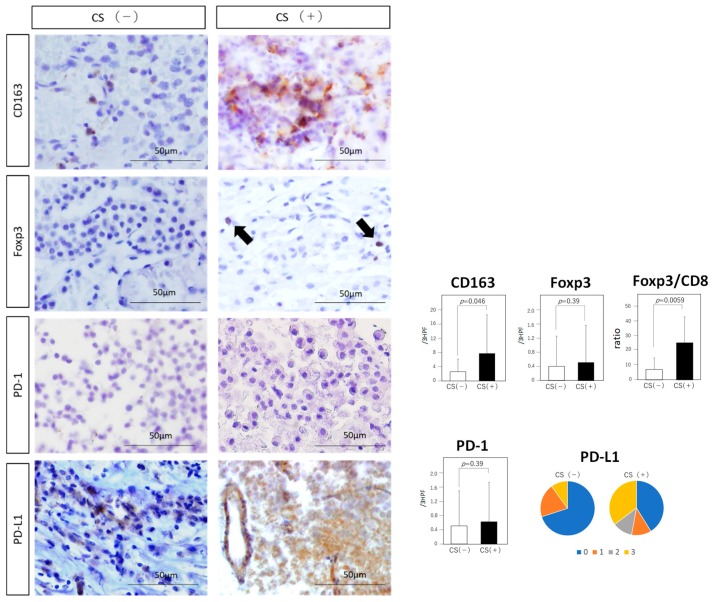
Figure 4.
Analysis of immunosuppressive cells and immune checkpoint molecules. Immunohistochemical analysis of CD163, Foxp3, PD-1, and PD-L1 (Original magnification, ×20). Typical examples of each staining are shown in both groups. Black arrow: tumor cell showing positive Foxp3 expression. The number of CD163 (+) tumor-associated macrophages (TAMs) and Foxp3/CD8 ratio are significantly higher in the CS (+) group than in the CS (−) group (CD163: p = 0.046, Foxp3/CD8: p = 0.0059). The score of PD-L1 tends to be higher in the CS (+) group than in the CS (−) group (p = 0.050). Expressions of Foxp3 and PD-1 do not reach statistical significance (Foxp3: p = 0.39, PD-1: p = 0.39). Data represent the mean ± standard error of mean (CD163, Foxp3, PD-1 and Foxp3/CD8 ratio, student’s t-test; PD-L1, Mann-Whitney U test).

