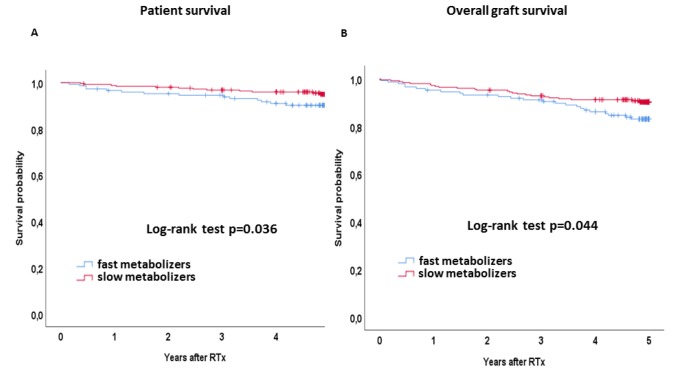
Figure 2.
(A) Kaplan-Meier curves for patient survival and (B) overall graft survival. Survival rates of slow (red lines) and fast metabolizers (blue lines) were analyzed by the Kaplan–Meier method and compared using the log-rank test. Fast metabolizers showed a noticeably reduced patient and overall graft survival.

