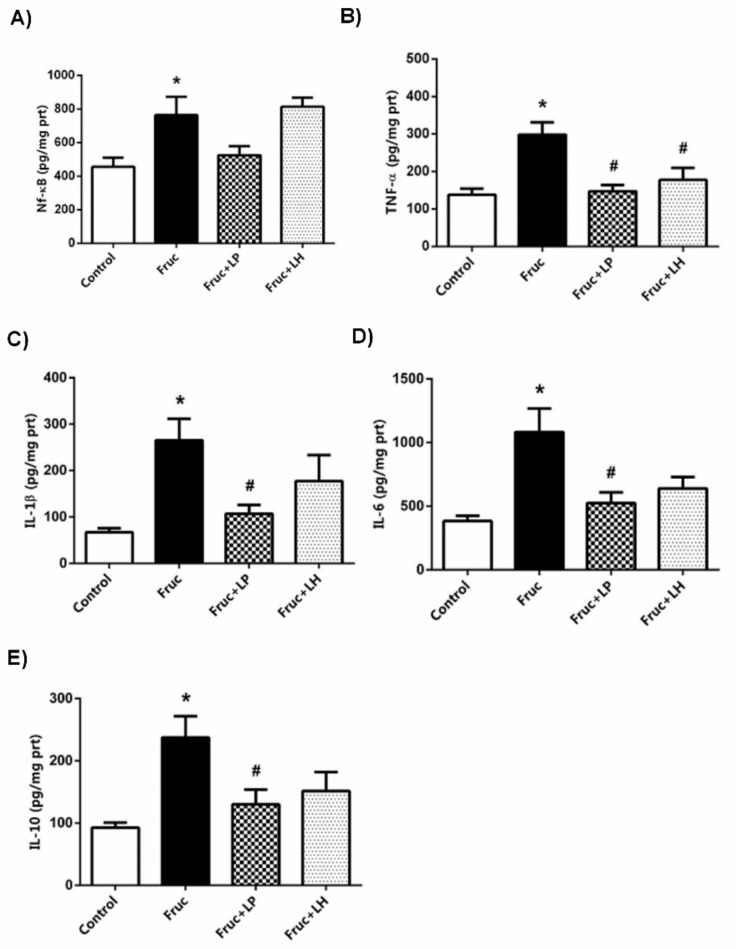
Figure 3.
The levels of NF-ĸB (a), TNF-α (b), IL-1β (c), IL-6 (d), and IL-10 (e) in kidney tissues of Control, Fruc, Fruc + LP, and Fruc + LH groups. Each bar represents the means from at least six rats. * p < 0.05, significantly different from the control; # p < 0.05, significantly different from fructose. Fruc: Fructose; LP: L. Plantarum; LH: L. Helveticus; NF-ĸB: nuclear factor-kappa B; TNF-α: tumor necrosis factor α; IL: interleukin.

