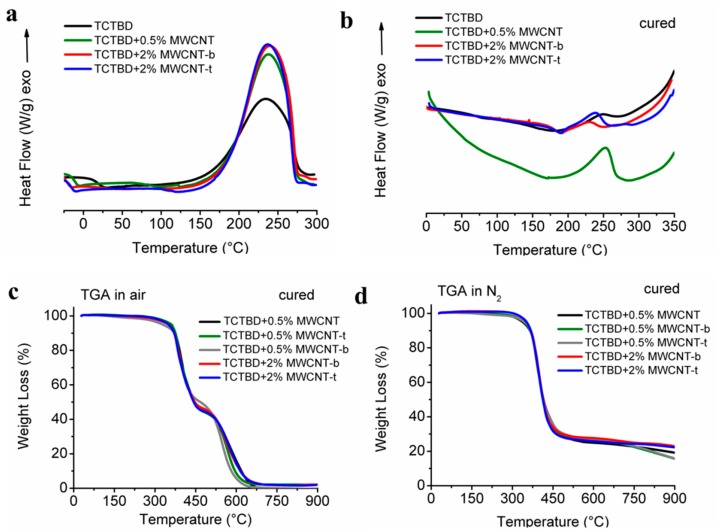
Figure 7.
(a) Differential scanning colorimetry (DSC) graphic of the sample TCTBD and the samples TCTBD + 0.5% MWCNT, TCTBD + 2% MWCNT-b, TCTBD + 2% MWCNT-t; (b) DSC graphics of the solidified sample TCTBD and the samples TCTBD + 0.5% MWCNT, TCTBD + 2% MWCNT-b, TCTBD + 2% MWCNT-t; (c) TGA graphics of the cured sample TCTBD filled with nonfunctionalized MWCNTs and two different percentages of functionalized MWCNTs, in airflow; (d) TGA graphics of the solidified sample TCTBD filled with nonfunctionalized and two different percentages of functionalized MWCNTs, in nitrogen flow.

