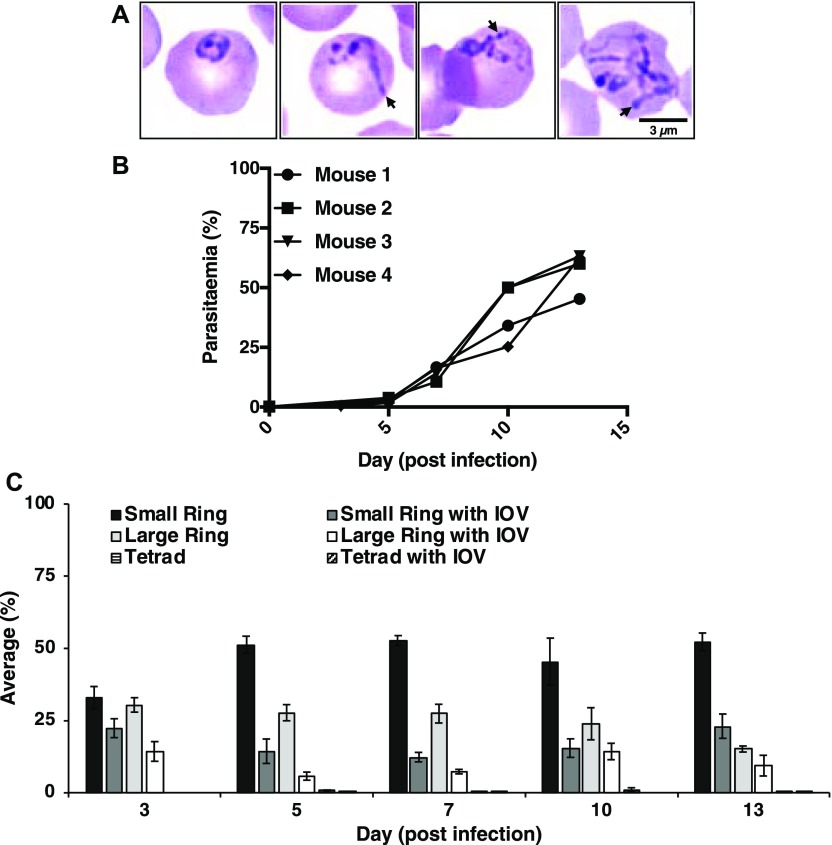
Figure 2. B. microti develops an IOV system in the cytoplasm of the infected erythrocytes.
(A) Representative images of Giemsa-stained blood smears from B. microti (LabS1)–infected erythrocytes. Long membranous structures within the erythrocyte cytoplasm are indicated by arrowheads. Scale bar: 3 μm. (B, C) Analysis of blood from four B. microti–infected SCID mice over a 13-d period after infection with the LabS1 strain. (B) Parasitemia levels in individual mice. For each sample, a total of 5,000 erythrocytes were analyzed. (C) Proportion of each morphological form detected in the blood smears at days 3, 5, 7, 10, and 13 postinfection. A total of 20 images were analyzed per smear at a given day (Mean ± SEM).

