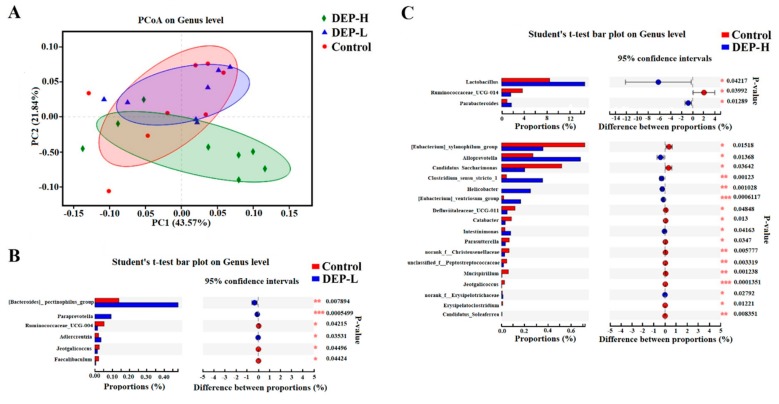
Figure 5.
Altered gut microbiome community structure induced by DEP. (A) Principal coordinate analysis (PCoA) plots of gut microbiome patterns (circles, control; triangles, DEP-L; diamonds, DEP-H). The percentage of variation explained by the plotted principal coordinates is indicated on the axes. (B, C) Significantly altered genera analyzed by the Student’s t-test in the DEP-L and DEP-H groups, respectively, compared with the control.

