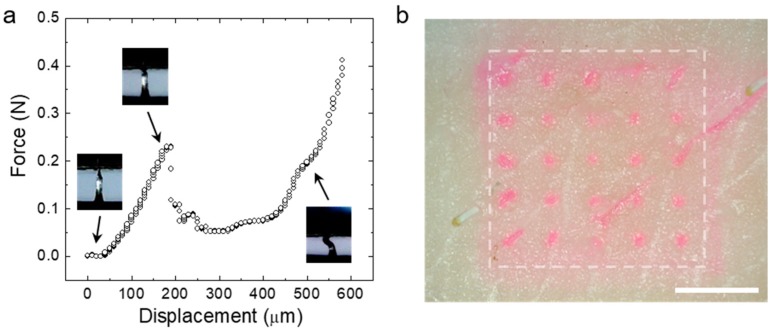
Figure 4.
(a) The force displacement profile obtained from the axial compression test of the single CS MN. Snapshot images showing the response for the CS MN corresponding to the displacement point. (b) The photo image of the pig skin after the insertion test using the rhodamine dye-loaded CS MN array (Scale bar; 2 mm).

