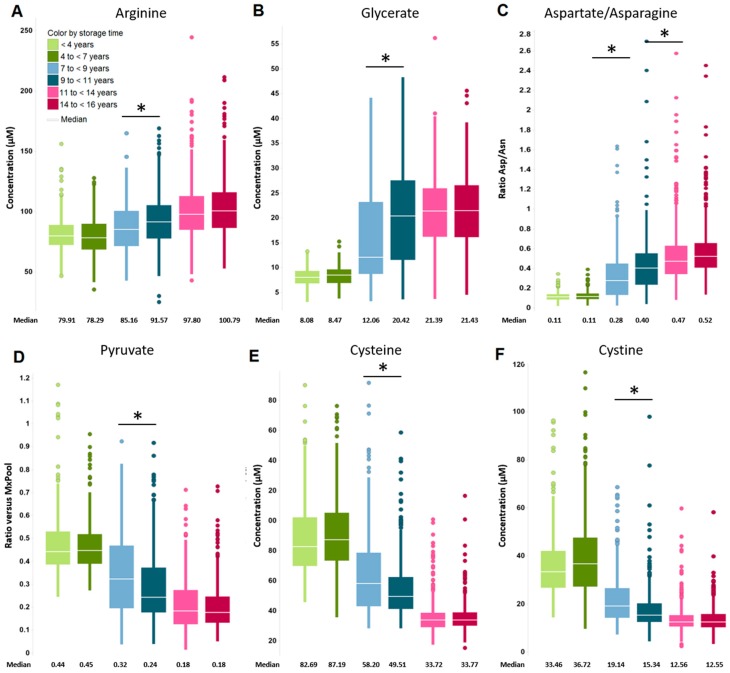
Figure 1.
Metabolites or metabolite ratios that were elevated: (A) arginine, (B) glycerate, (C) the ratio of aspartate over asparagine or decreased (D) pyruvate, (E) cysteine, (F) cystine in concentration by prolonged sample storage at −80 °C. Asterisk denotes significant changes (p < 0.05, FDR < 0.05) within subject age groups. The legend is displayed in (A). Samples from one subject age group are shown in shades of the same color: 70 years of age = red; 75 years of age = blue; 80 years of age = green.

