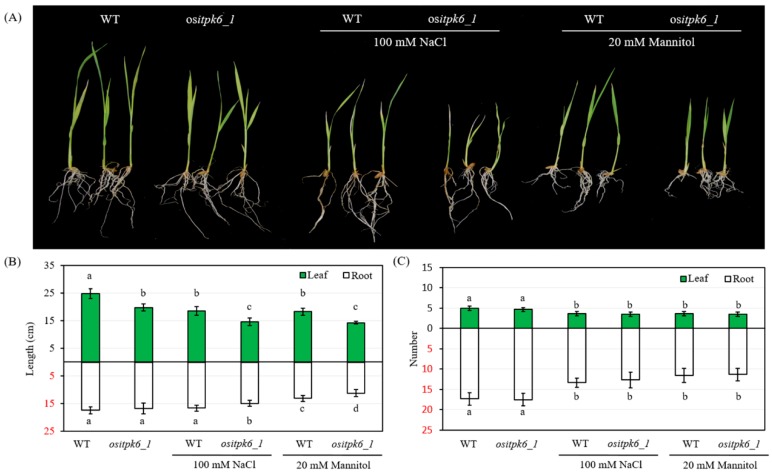
Figure 5.
The phenotypes of the mutant OsITPK6_1 and wild type under salt stress (100 mM NaCl) and drought stress (20 mM mannitol). (A) The picture was taken on the 7th day after treatment. (B,C) Six replicates were performed for the OsITPK6 mutant line and the wild type. Error bars represent the standard error. The different letters show significant differences at a probability of p < 0.05.

