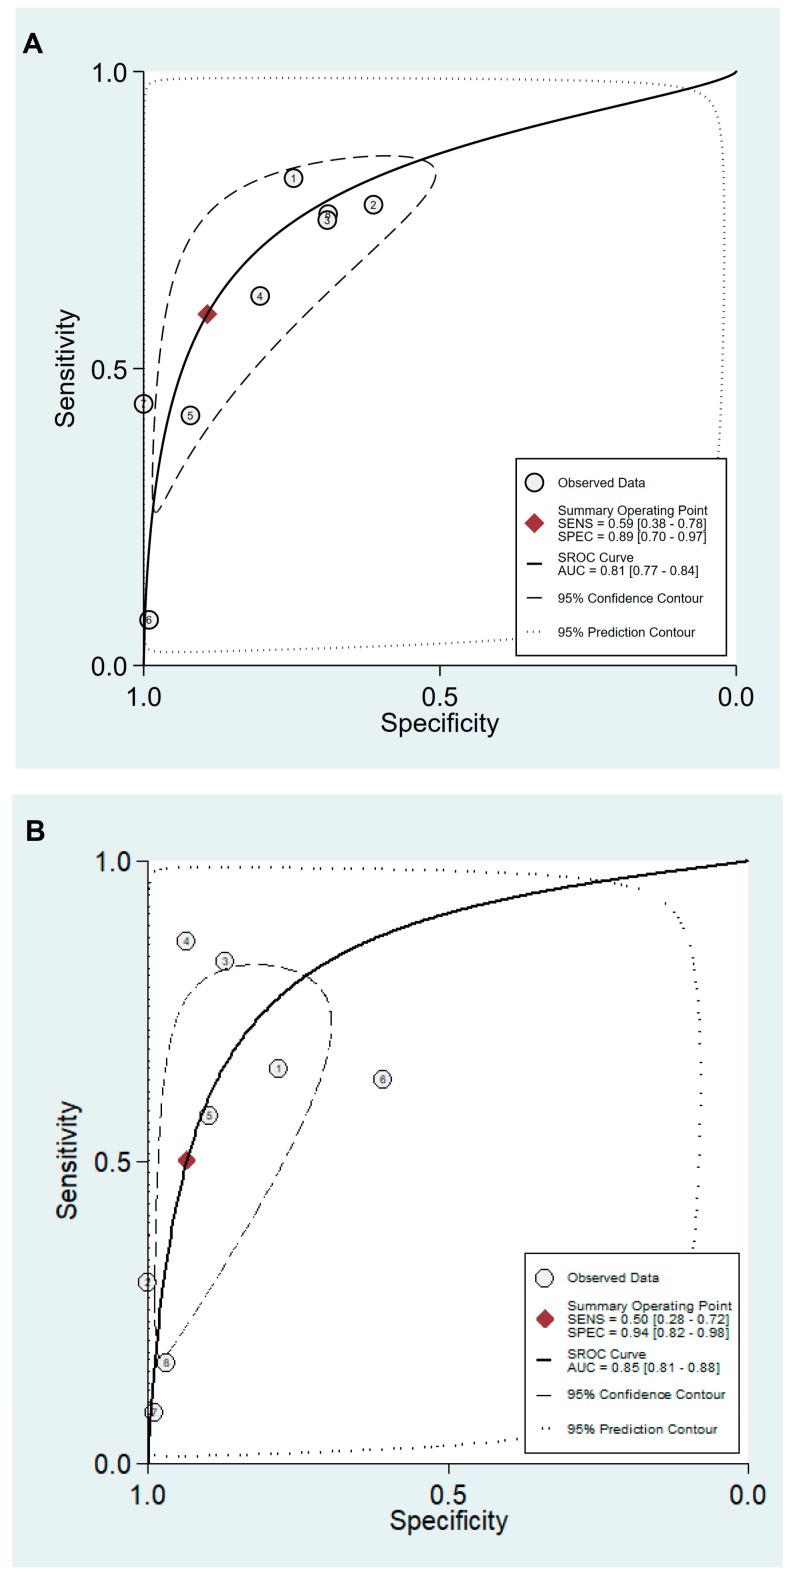
Figure 5.
SROC curve with 95% confidence region and prediction region for the diagnosis of CAG. (A) cut-off value with PG I ≤70 ng/mL and PG I/PG II ratio ≤3, (B) cut-off value with PG I/PG II ratio ≤3. SROC, summary receiver operating characteristic; CAG, chronic atrophic gastritis; PG, pepsinogen; SENS, sensitivity; SPEC, specificity; AUC, area under the curve.

