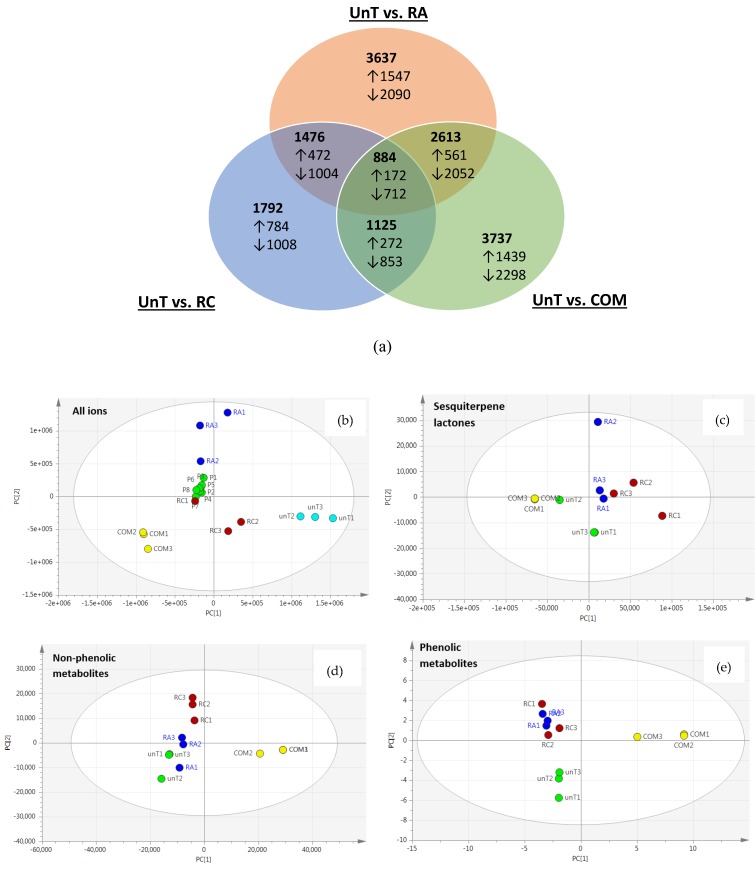
Figure 3.
Analysis of LC-MS metabolomic data. (a) Shows the number of the 5333 ions/metabolites measured which were significantly different (p < 0.05) in group comparisons. All L. sativa groups were compared simultaneously (Principal Component Analysis (PCA)) to build a model encompassing (b) all 5333 detected metabolites, (c) sesquiterpene lactone metabolites (12), (d) non-phenolic metabolites (24) and (e) phenolic metabolites (40). Each L. sativa group is indicated with: unT: untransformed tissue culture plants (light blue); COM: commercially purchased plants (yellow); RA: rol ABC transformed plants (dark blue); and RC: rol C transformed plants (red). Pooled (P; green) samples included quality control purposes are shown in (b).

