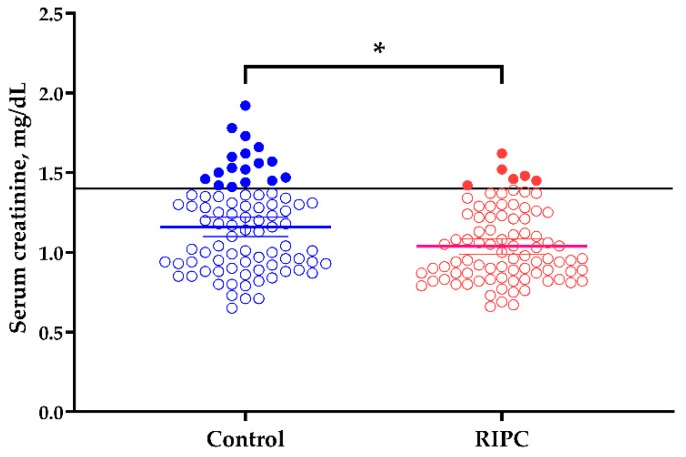
Figure 2.
Mean serum creatinine concentration at discharge. Closed circles indicate the patients who showed high serum creatinine concentration at discharge. The black horizontal line shows the upper normal limit of serum creatinine concentration (1.4 mg/dL). Mean serum creatinine concentrations with 95% confidence interval at discharge in control (1.13 (1.07–1.18)) and RIPC (1.01 (0.95–1.07)) groups are depicted in each column (blue: control, red: RIPC). *, p = 0.003.

