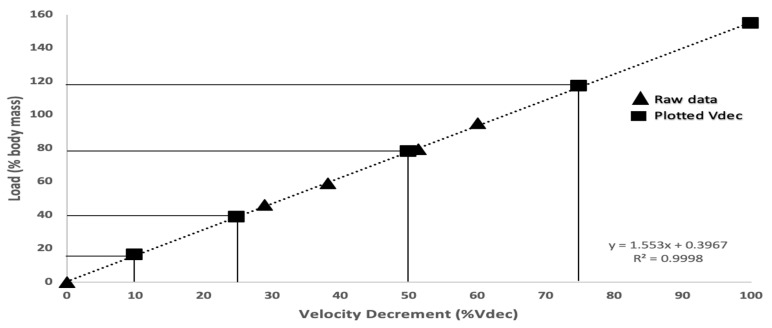
Figure 2.
An example of the load–velocity relationship for one subject. The raw data (▲) shows the maximum velocity (Vmax) collected during resisted and un-resisted sprints. Using the linear relationship between load and velocity, the plotted Vdec (■) shows the calculated loads corresponding to a 10, 25, 50, 75, and 100% decrement in velocity.

