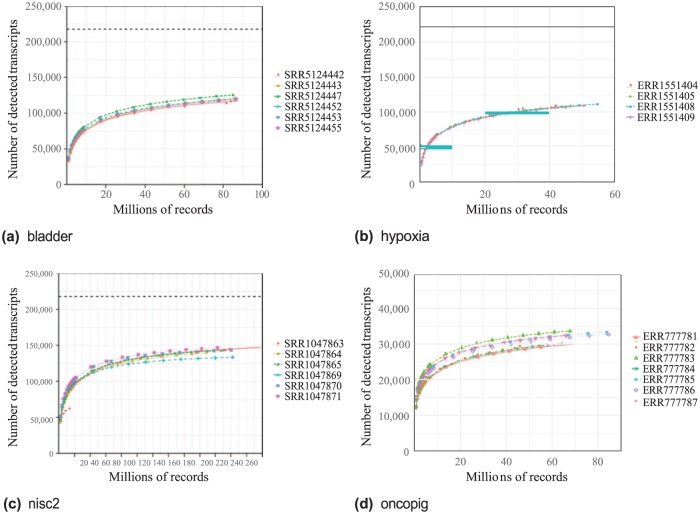
Figure 1.
Detected transcripts by number of records for 4 datasets. Each point indicates the number of transcripts with FPKM > 0 measured at the given number of records. All runs were identically analyzed using the workflow of the Scientific workflow section. FASTQ files were sampled at 1% to 100% of the records of the original dataset. Dashed lines at the top of each plot indicate the theoretical maximum number of detected transcripts (217 857 for human and 49 558 for pig). Species for bladder, hypoxia, and nisc2 is Homo sapiens. Species for oncopig is Sus scrofa. FPKM indicates Fragments Per Kilobase of transcript per Million mapped reads.

