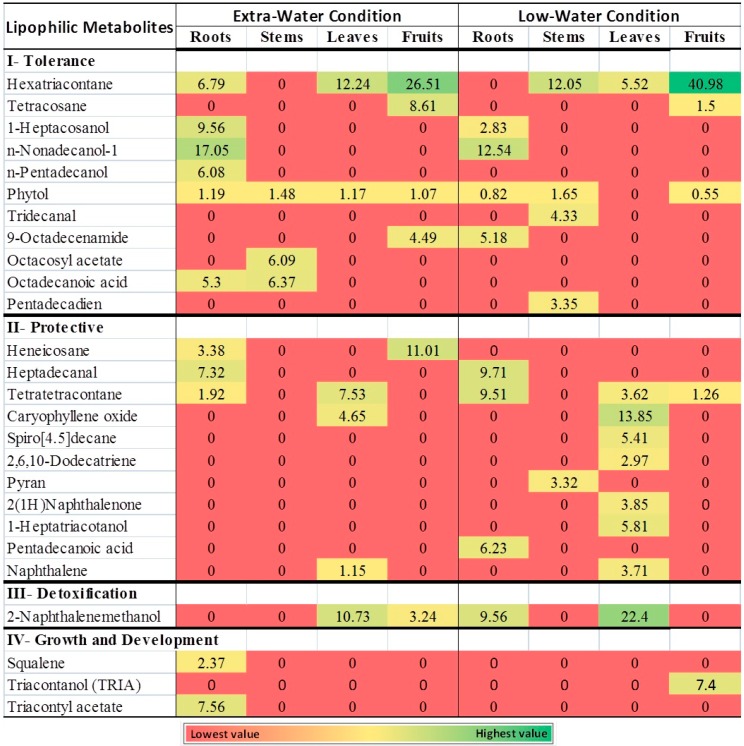
Figure 3.
Heatmap comparing the gas chromatography-mass spectrometry (GC-MS) analysis of the C. amblyocarpa plant growing either in extra-water or low-water conditions of the arid desert of Sharjah, UAE. The metabolite averages and relative percentages of three replicates are displayed as colors ranging from red to green, as shown above. The relative percentage of a metabolite is represented in relation to total areas of all detected metabolites in an extract.

