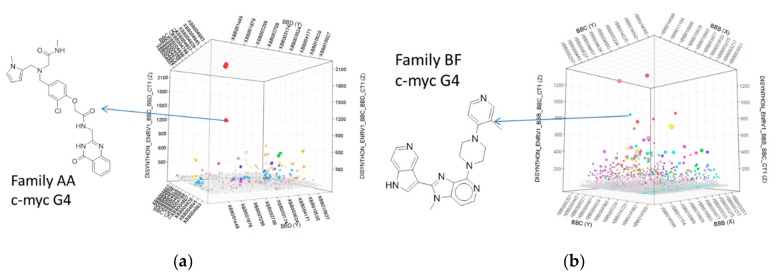
Figure 2.
3D scatter plots showing individual enriched features against the c-myc G4 oligonucleotide. These were used to inform the design of compounds for resynthesized without DNA attached. (a) Library A, with Family AA in red; (b) Library B, with Family BF in cerulean blue. Arrows indicate which of the enriched features represent the resynthesized active compounds. The x and y axes represent individual building blocks at the indicated cycles of synthesis. The z axis represents a statistical metric of enrichment significance (ENRv1) for each disynthon (negative log10 of the asymptotic significance value).

