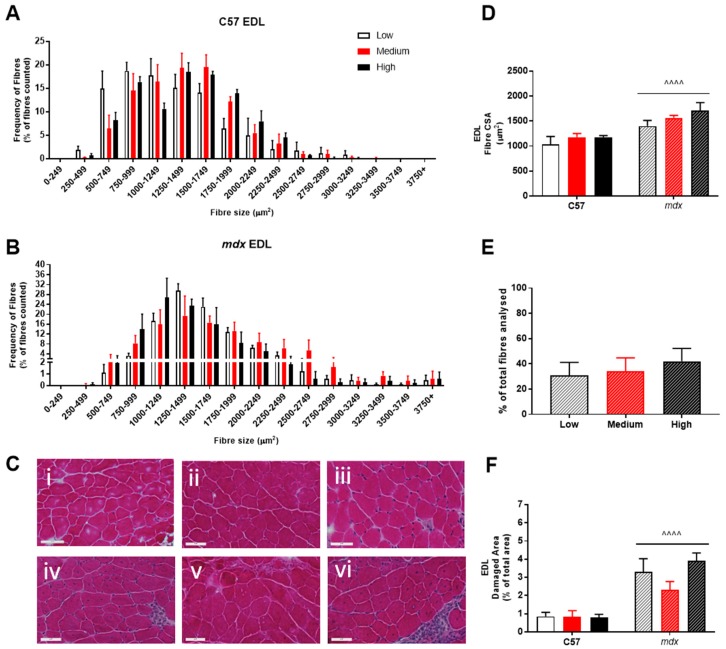
Figure 4.
Histological analysis of the EDL in non-dystrophic and mdx animals. Fibre size distribution in non-dystrophic (A) and mdx (B) animals treated with low (white bar), medium (red bar) and high (black bar) vitamin D enriched diets. Representative images are depicted in panel (C); low, medium and high vitamin D diets (C57 i–iii and mdx iv–vi, respectively). Fibre cross-sectional area (D), percentage of regeneration (E); mdx only) and damage (F) was also analysed in non-dystrophic C57 and mdx mice fed low, medium and high amounts of vitamin D. Symbols indicate: ^^^^ p < 0.0001, significantly different to C57 strain. All groups n = 4. Scale bar = 50 μm.

