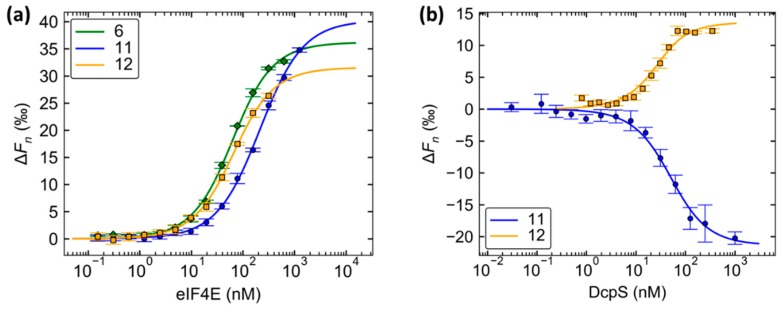
Figure 5.
Direct binding microscale thermophoresis (MST) experiments with eIF4E and DcpS. (a) MST binding curves for probes 6, 11, 12, and meIF4E. Probe 6, 11, or 12 (50 nM) was mixed with a half-log dilution series of an meIF4E solution (10 µM–0.30 nM). (b) MST binding curves for probes 11 and 12 and DcpS. A solution of probe 11 or 12 (50 nM) was mixed with a dilution series of hDcpS solution (2.0 µM–0.061 nM for 11; 700–1.6 nM for 12). MST traces for each experiment are shown in Figures S5 and S6. Data were analyzed in Palmist v. 1.4.4 using 1:1 binding model. The KD values were calculated from triplicate experiments and are shown in Table 2.

