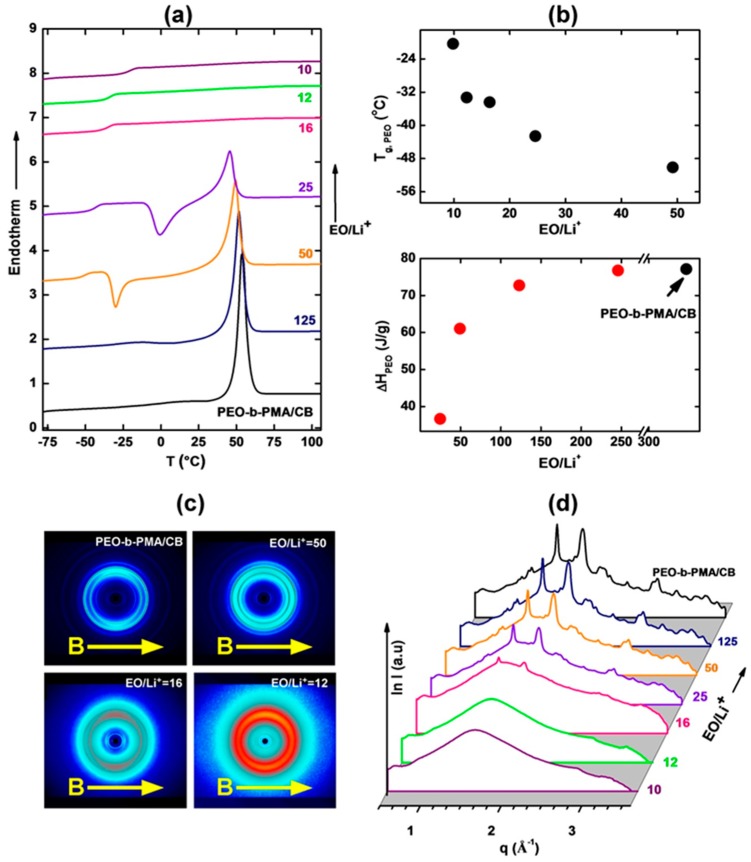
Figure 3.
(a) DSC data of the PEO-b-PMA/CB system at different Li-doping levels as indicated (b) Corresponding glass transition temperature of PEO and PEO melting enthalpy of the system. Data clearly indicate a glass transition temperature increase and suppression of PEO crystallization with the inclusion of Li+. The DSC data are corroborated by the 2D WAXS data shown in (c). (d) Circularly integrated WAXS data for different EO:Li+ ratios. PEO diffraction peaks display uniform azimuthal distribution indicating lack of preferential orientation of the PEO chains in the field-aligned samples.

