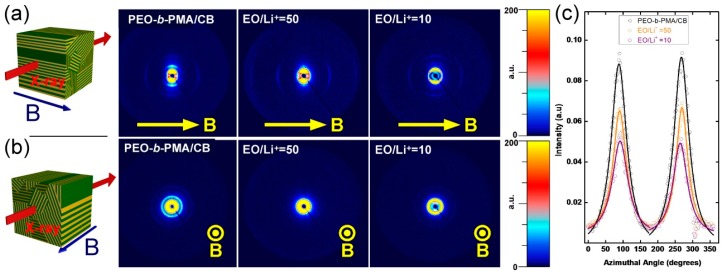
Figure 5.
(a) Room temperature 2D SAXS data of EO-MA/CB samples at different EO:Li+ ratios, where the field was kept horizontal with respect to the X-ray detector’s plane (top panel) and the corresponding azimuthal intensity profiles of the BCP super structure peak (c). (b) Room temperature 2D SAXS data of the same samples when the field was applied normal with respect to the X-ray detector’s plane (bottom panel).

