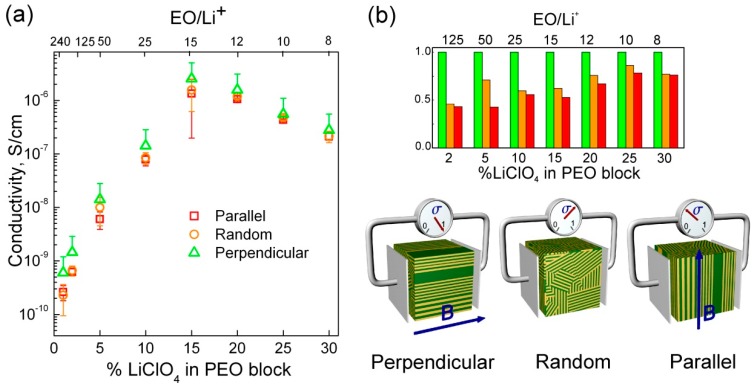
Figure 8.
(a) Room temperature conductivities as a function of lamellar domains orientation shown for samples with different ethylene oxide units to Li ion ratio. (b) Linear representation of conductivity data normalized to the conductivity of samples with perpendicular domains orientation (green bars). The error bars represent standard deviation of at least three independently repeated measurements for each data point.

