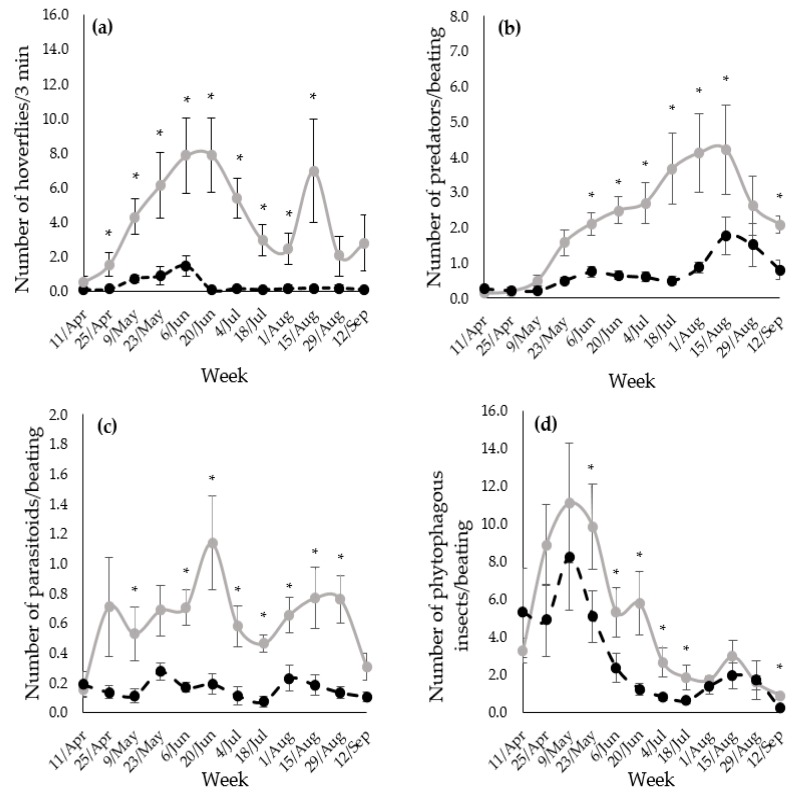
Figure 2.
(a) Number of adult hoverflies per three minutes, (b) number of predators per beating, (c) number of parasitoid wasps per beating, and (d) number of phytophagous insects per beating in the flower margin (grey line) and in the spontaneous margin (black dashed line). Vertical bars show standard error. Data presented as average of 2015 and 2016 per week in 1 m2. ns = p >0.05, *= p <0.05.

