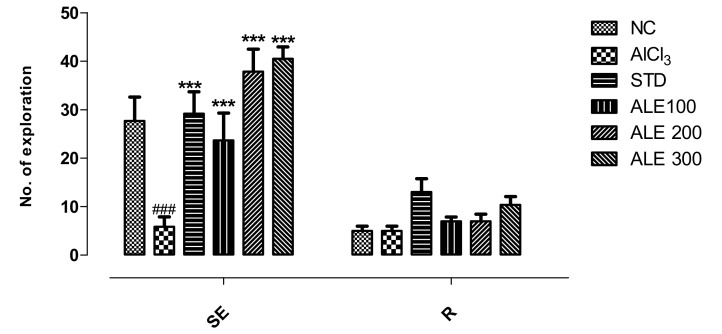
Figure 5.
Horizontal exploration (SE) and rearing (R) among groups in open field test; values are expressed as mean ±SEM, n = 6. The intergroup variation was measured by prism two-way ANOVA followed by Bonferroni post hoc test. *** P < 0.001 was given in comparison to AlCl3 group. ### P ≤ 0.001 was given in comparison to normal control.

