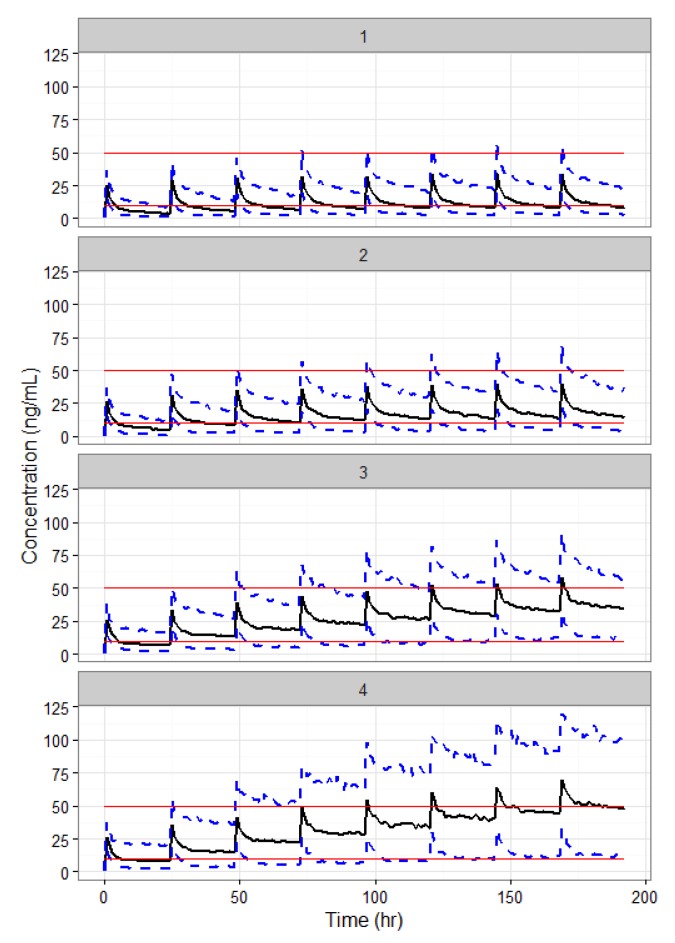
Figure 3.
Simulations for plasma vancomycin concentration by virtual patient groups receiving daily 1 g vancomycin (1-h intravenous infusion). Group 1: patients with estimated serum creatinine clearance of 100 mL/min, Group 2: patients with estimated serum creatinine clearance of 40 mL/min CLCR, Group 3: patients receiving continuous renal replacement during vancomycin therapy, Group 4: patients receiving hemodialysis during vancomycin therapy. The black solid line represents the median, the blue lines are 90% prediction intervals, and the red lines are the representative target Cpeak (50 mg/L) and Ctrough (10 mg/L) of VCM.

