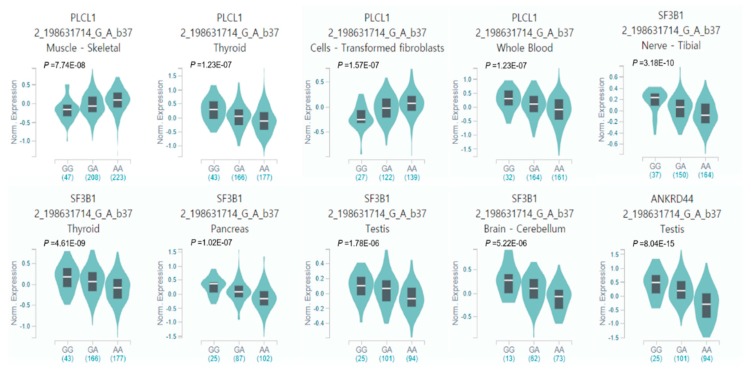
Figure 4.
Violin plots of allele-specific cis-eQTLs according to rs700651 genotypes (2_198631714_G_A_b37) in human tissues in the Genotype-Tissue Expression (GTEx, release v7 and human genome build 37) database (p < 1 × 10⁻⁶). G and A alleles indicate the reference (minor) and alternative (major) allele types, respectively. The teal region indicates the density distribution of the samples in each genotype. The white line in the box plot (black) shows the median value of the expression of each genotype.

