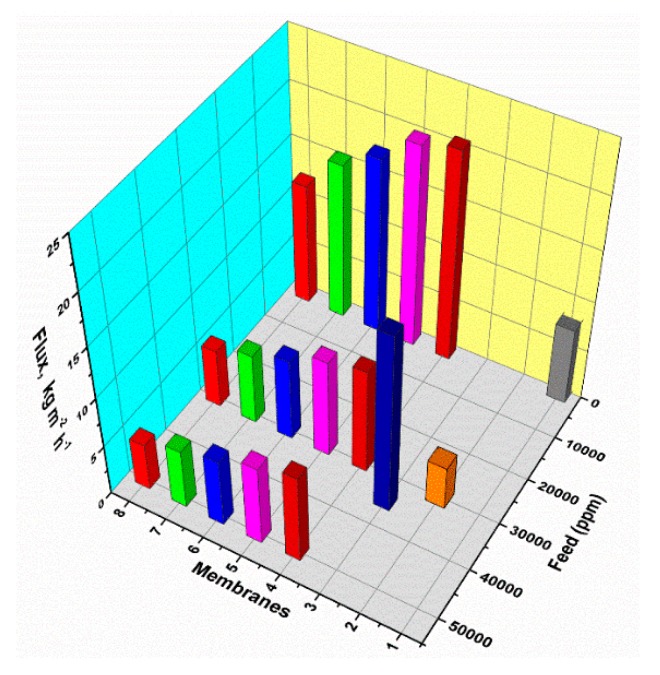
Figure 20.
Variation of flux as the function of feed concentrations of different membranes (1: PEBA/PAN/PE, 2: 20zeolite 3A/PEBA, 3: GO/CS, 4: PVA-SiO2/PVSF hollow fiber (thickness: 0.22 ± 0.03 μm), 5: PVA-SiO2/PVSF hollow fiber (thickness: 0.30 ± 0.03 μm), 6: PVA-SiO2/PVSF hollow fiber (thickness: 0.60 ± 0.05 μm), 7: PVA-SiO2/PVSF hollow fiber (thickness: 0.85 ± 0.07 μm), and 8: PVA-SiO2/PVSF hollow fiber (thickness: 1.13 ± 0.11 μm) at 60 °C.

