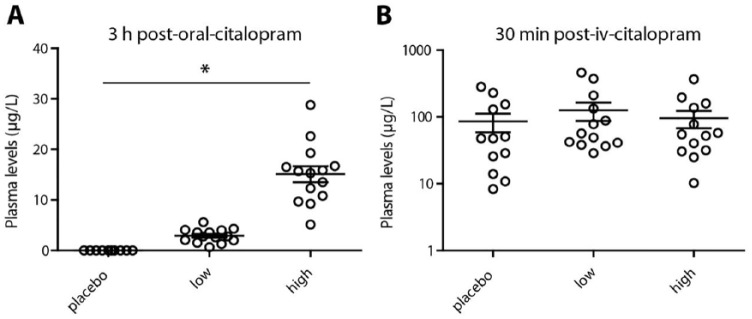
Figure 4.
Blood plasma levels. Blood samples were collected before the second single photon emission computed tomography (SPECT) scan and after the pharmacological magnetic resonance imaging (phMRI) scan. Citalopram plasma levels (μg/L) were determined using mass spectrometry. (a) Citalopram plasma levels prior to SPECT 2 at 3 h post-oral-citalopram. (b) Citalopram plasma levels after the phMRI scan at 30 min post-iv- citalopram on a log scale.
*Analysis of variance: p<0.05
iv: intravenous

