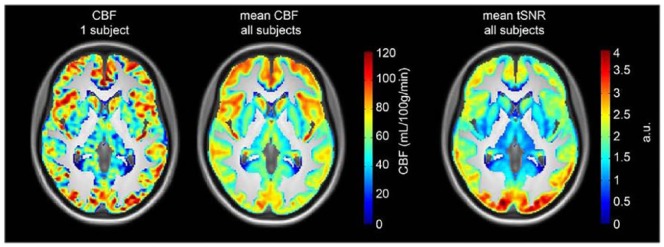
Figure 6.
Arterial spin labelling (ASL) data quality. Left: a representative cerebral blood flow (CBF) map of one subject for a 5-min ASL acquisition. Centre: the mean CBF map averaged over all subjects. Right: the mean temporal signal to noise ratio (tSNR) map averaged over all subjects. All maps are masked with a grey matter mask (>25% probability of being grey matter) and overlaid on the mean T1 image of all subjects.

