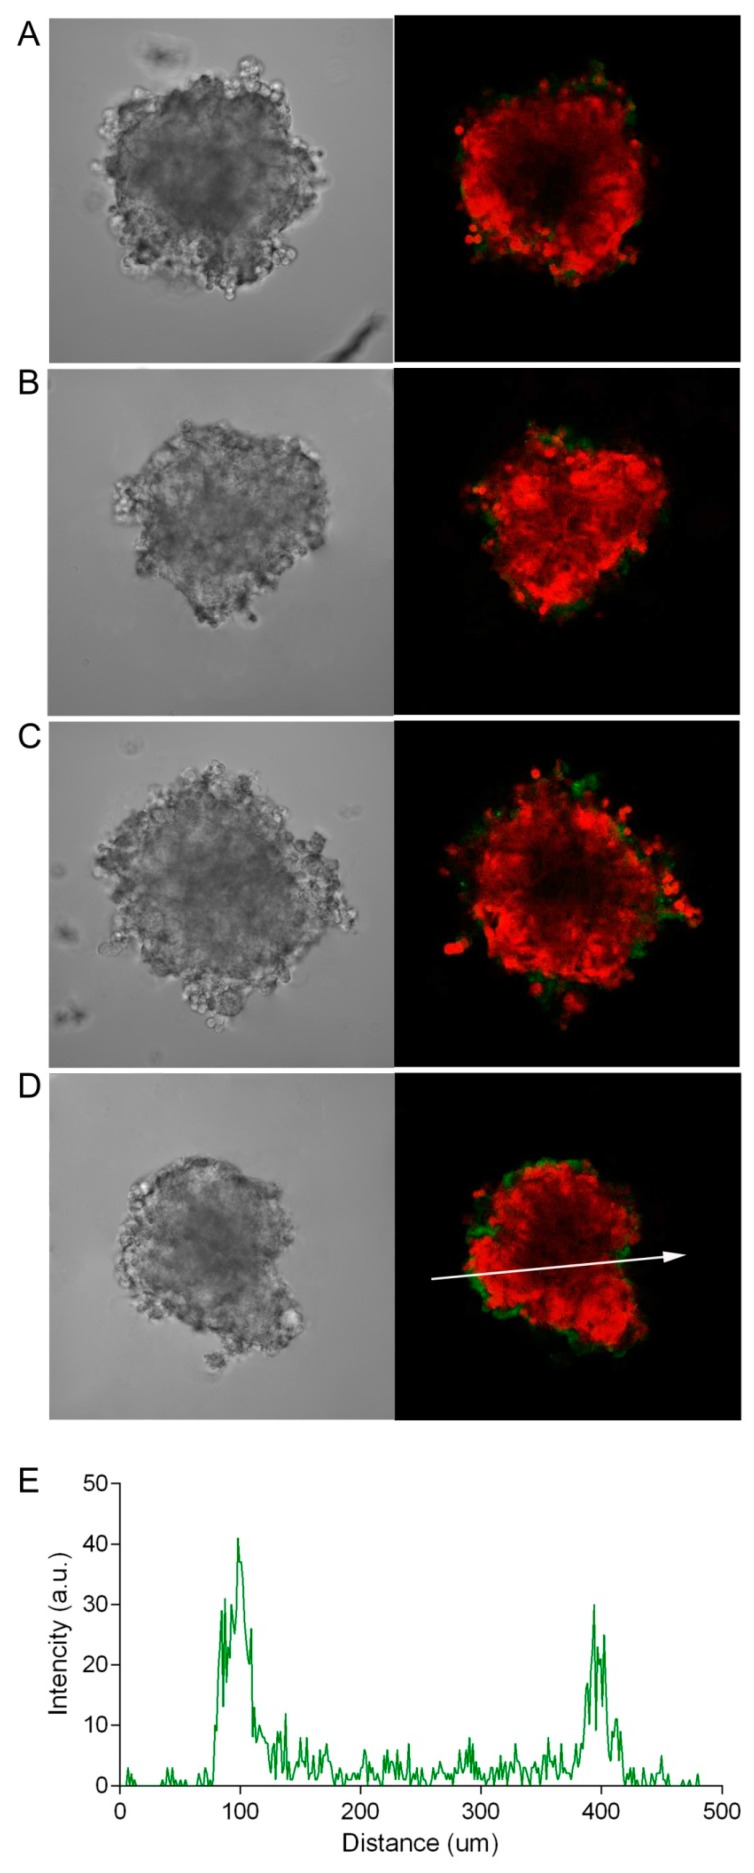
Figure 4.
Dynamics of the penetration of FITC-labeled bovine serum albumin (BSA) into SKOV-kat spheroids. The SKOV-kat spheroids (red) were analyzed by confocal microscopy in control (no BSA, A) and after incubation with FITC-labeled BSA (green) for 2, 12, or 24 h (B–D, respectively). Image size is 698 × 698 μm. The fluorescence intensity profile (E) shows the fluorescence intensity of FITC-labeled BSA along the randomly positioned arrow in (D).

