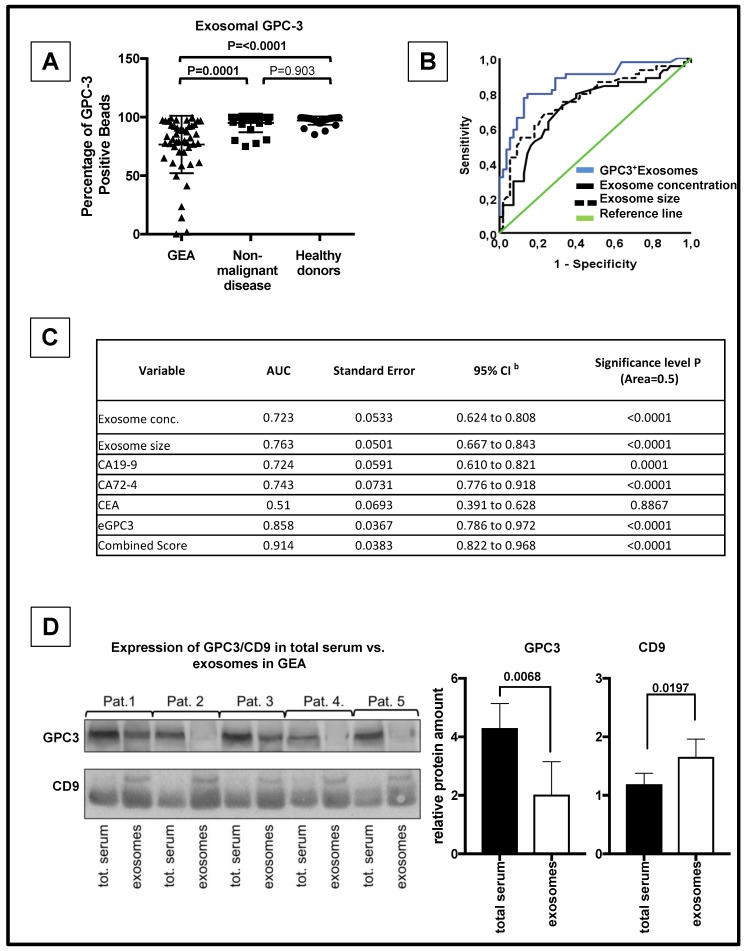
Figure 2.
Decreased serum levels of eGPC3 in GEA patients. (A) Dot plot analysis of the percentage of GPC3 positive exosome-bound latex beads in serum from patients with GEA, patients with non-malignant disease and healthy donors. (B) Receiver operating characteristics (ROC) curve analysis of eGPC3 (blue), exosome concentration (black), and exosome size (dashed line) for patients with GEA vs. patients with non-malignant disease and healthy donors. (C) ROC curve analysis showing the area under the curve (AUC) for eGPC3, exosome concentration, exosome size, serum CA 19-9, serum CA 72-4, serum CEA and a combined score (eGPC3* CA 72-4)/CA 19-9) for patients with GEA vs. patients with non-malignant disease and healthy donors. (D) Protein expression analysis of GPC3 and CD9 in total serum and corresponding exosomes from five patients with GEA (left panel). Quantification of GPC3 and CD9 protein expression is shown on the left panel (right panel; p < 0.05).

