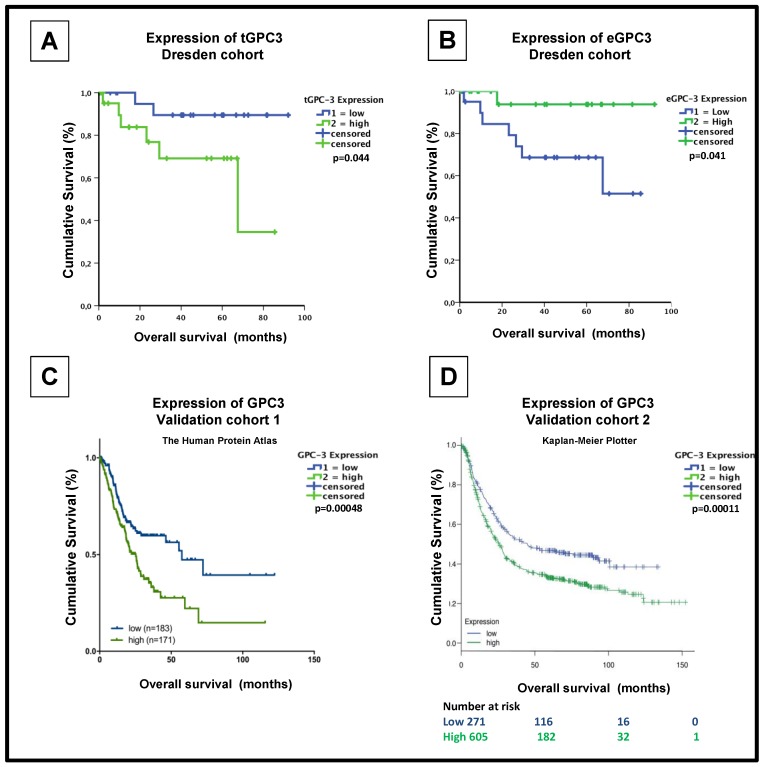
Figure 3.
Expression of GPC3 in GEA tumor tissues correlates to poor overall survival. (A) Kaplan-Meier curve (months) from Dresden GEA cohort. High expression of GPC3 protein levels (green line) on GEA tissue conferring a poorer prognosis compared to patients with low GPC3 expression (blue line). (B) Kaplan-Meier curve (months) depicting overall survival in patients with high (green line) and low (blue line) percentage of expression of exosome-bound latex beads stained against GPC3. (C) Kaplan-Meier curve (months) from the Human Protein Atlas conferring overall survival in patients with high (green line) and low (blue line) expression of GPC3 in primary GEA cancer (n = 354; source: v18.proteinatlas.org/ENSG00000147257-GPC3/pathology) [30]. (D) Kaplan-Meier curve (months) depicting overall survival in patients with high (green line) and low (blue line) mRNA expression of GPC3 in gastric cancer (n = 876; source: [31])

