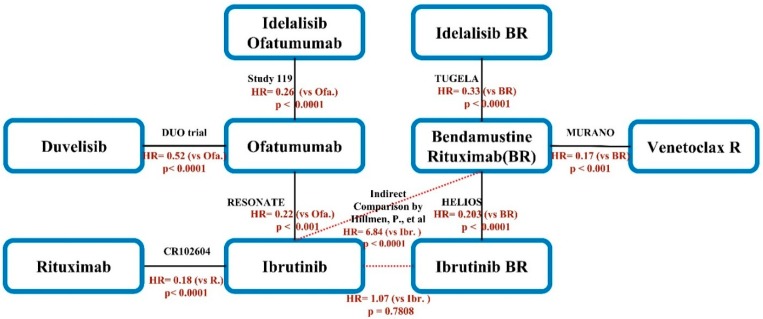
Figure 2.
Schematic diagram of the network of evidence used in network meta-analysis (NMA). The black line indicates a direct comparison from RCT. The name of the trial and the published year are noted in black. The hazard ratio of PFS is noted in orange. The red dotted line indicates the individualized indirect comparison data published by Hillmen et al. HR: Hazard ratio, BR: Bendamustine + Rituximab, R: Rituximab, P: P-value.

