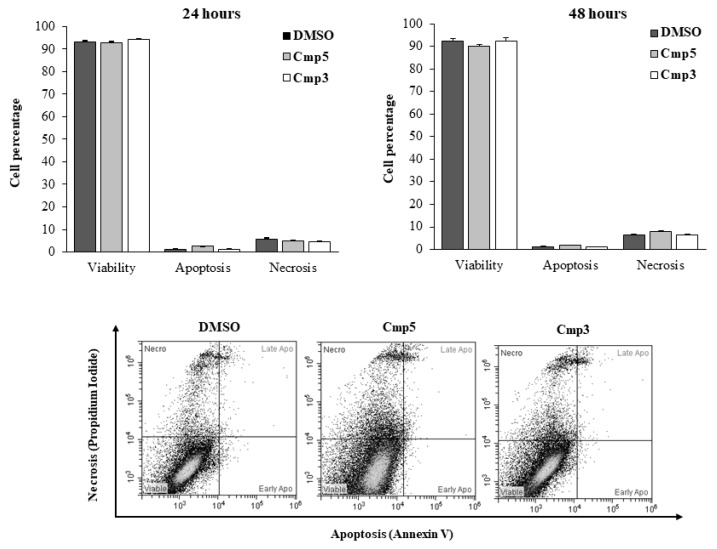
Figure 4.
Induction of apoptosis and necrosis in C6 cells in the presence of Cmp5 and Cmp3. Percentages of cells found in the various phases of cell death, analyzed by flow cytometry after staining with Annexin V-FITC and propidium iodide (PI), are shown in the upper panel. Bars represent the percentage of viable cells (unstained), cells in apoptosis (Annexin V-positive), cells in late apoptosis (Annexin V+PI), and cells in necrosis (PI) as medians ± SD calculated from three independent experiments. Representative dual-parameter fluorescence density dot plots at 48 h are displayed in the lower panel.

